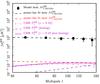
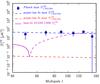
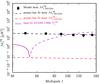
Fig. 4
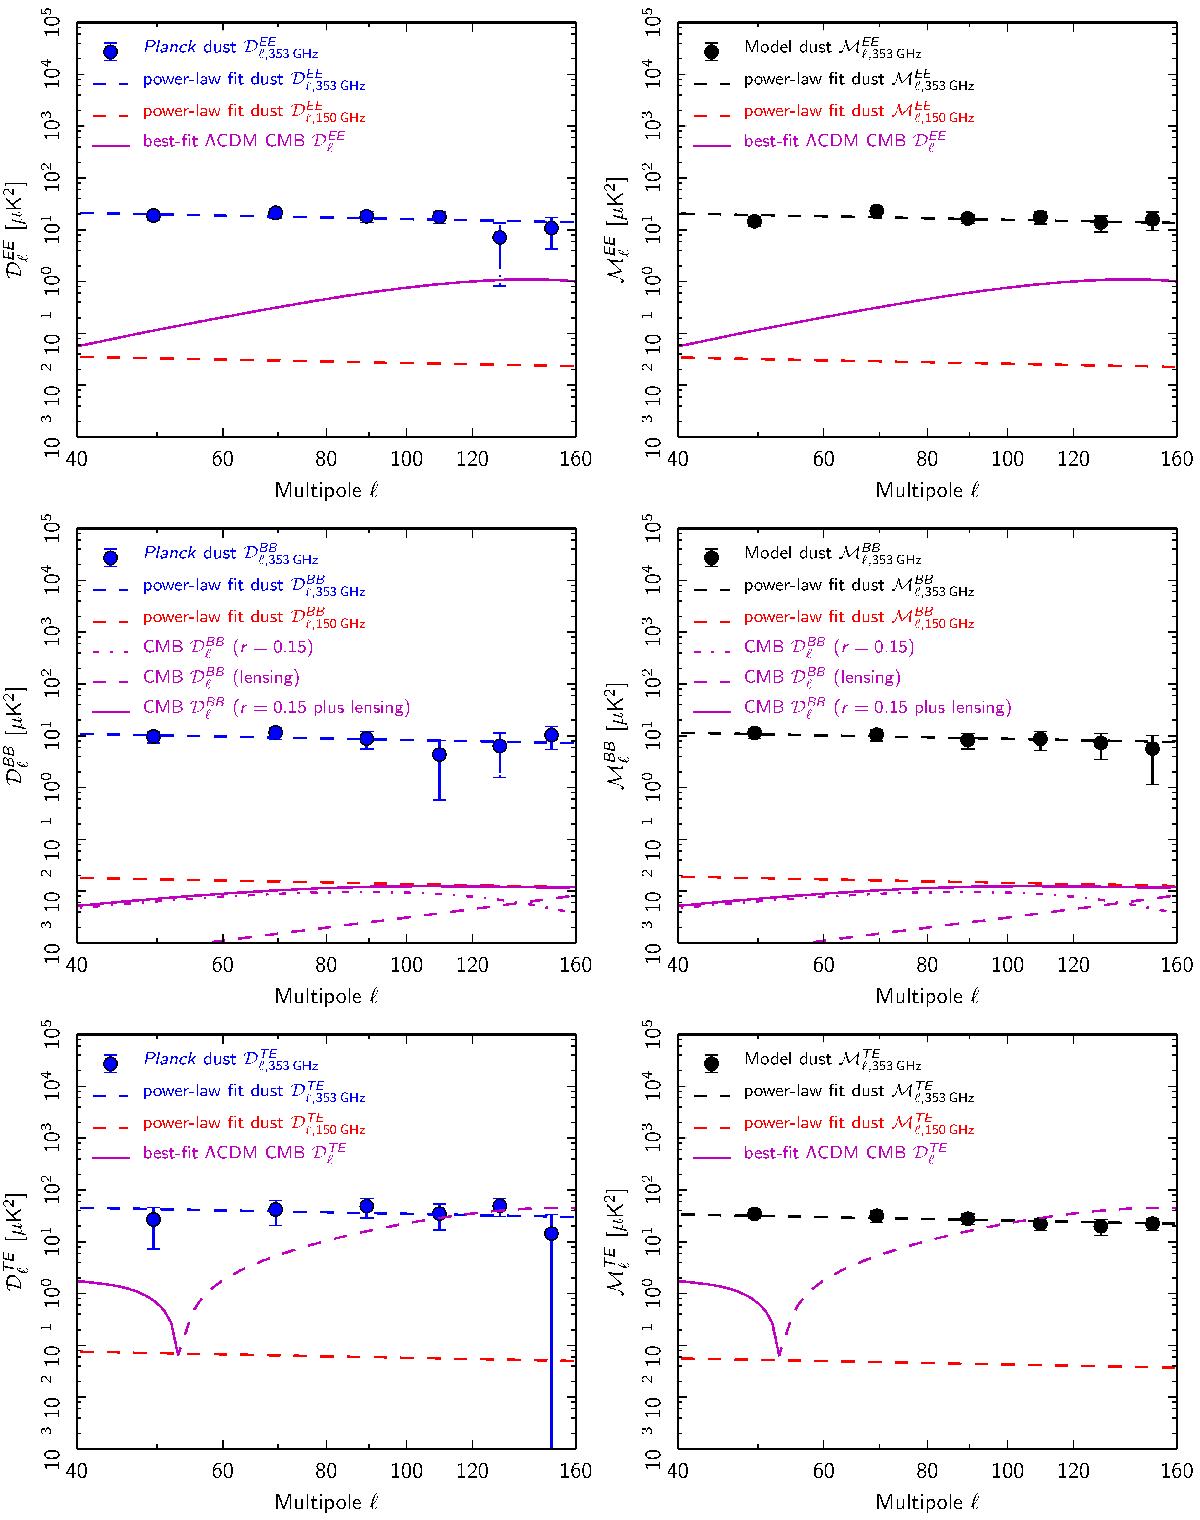
Left column: Planck 353GHz ![]() (top row),
(top row), ![]() (middle row), and
(middle row), and ![]() (bottom row) power spectra in units of
(bottom row) power spectra in units of ![]() computed over SGC34 using the subsets of the Planck data. See text calculation of 1σ error bars. The best-fit power law assuming exponent −2.3 is plotted for each power spectrum (dashed blue line). For comparison, we also show the Planck 2015 best-fit ΛCDM expectation curves for the CMB signal (Planck Collaboration XIII 2016), with the TE expectation shown as dashed where it is negative. Extrapolations of the dust power spectra to 150GHz (see text) are plotted as dashed red lines. Right column: similar to left panels, but for the dust model (Sect.5.4).
computed over SGC34 using the subsets of the Planck data. See text calculation of 1σ error bars. The best-fit power law assuming exponent −2.3 is plotted for each power spectrum (dashed blue line). For comparison, we also show the Planck 2015 best-fit ΛCDM expectation curves for the CMB signal (Planck Collaboration XIII 2016), with the TE expectation shown as dashed where it is negative. Extrapolations of the dust power spectra to 150GHz (see text) are plotted as dashed red lines. Right column: similar to left panels, but for the dust model (Sect.5.4).
Current usage metrics show cumulative count of Article Views (full-text article views including HTML views, PDF and ePub downloads, according to the available data) and Abstracts Views on Vision4Press platform.
Data correspond to usage on the plateform after 2015. The current usage metrics is available 48-96 hours after online publication and is updated daily on week days.
Initial download of the metrics may take a while.