Fig. 2
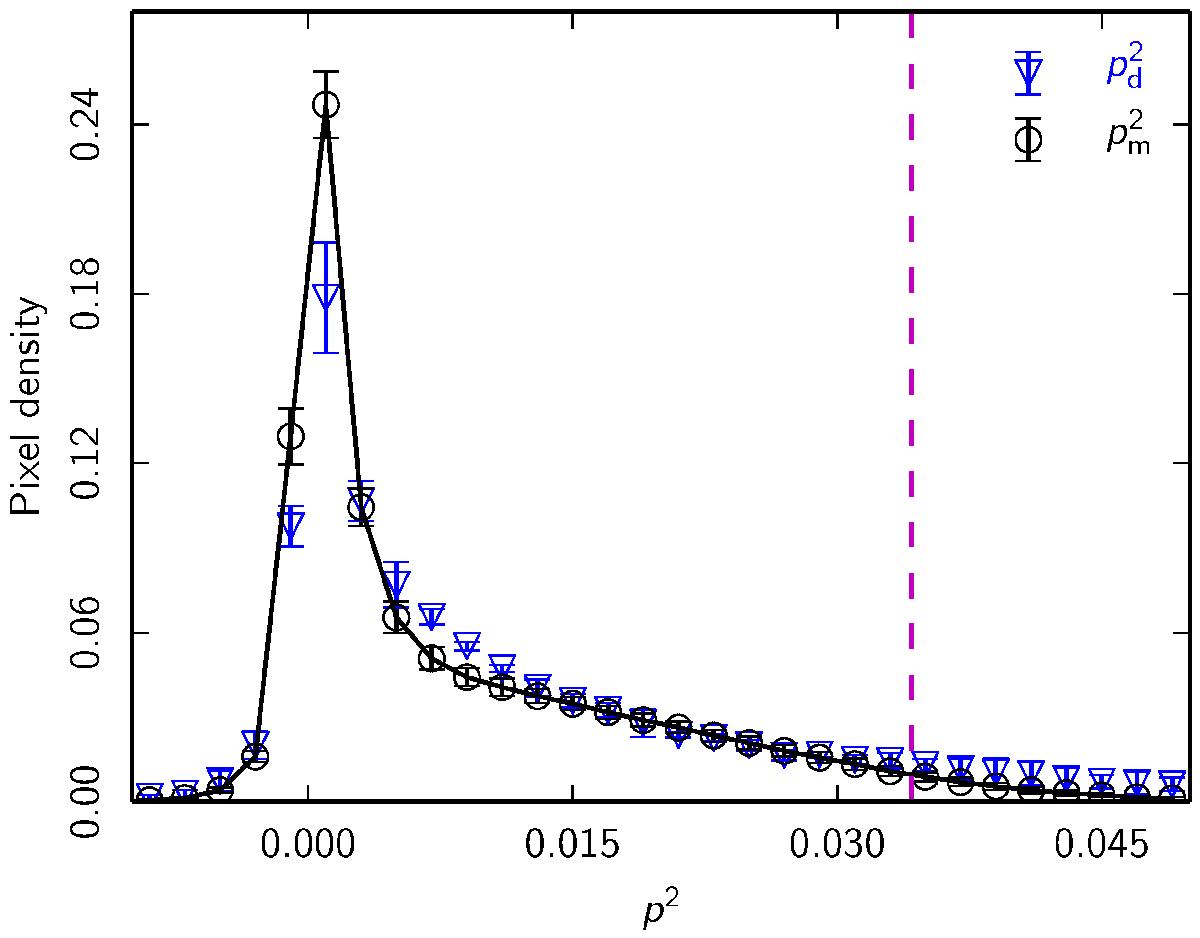
Normalized histograms of p2 over SGC34 at 353GHz. Planck data, ![]() , blue inverted-triangles, with 1σerror bars as described in text. The pixel density on the y-axis is the number of pixels in each bin of p2 divided by the total number of pixels over SGC34. Dust model,
, blue inverted-triangles, with 1σerror bars as described in text. The pixel density on the y-axis is the number of pixels in each bin of p2 divided by the total number of pixels over SGC34. Dust model, ![]() , black circles connected by line, with 1σ error bars computed from 100Monte-Carlo realizations. The vertical dashed line corresponds to the parameter p0 = 18.5% (
, black circles connected by line, with 1σ error bars computed from 100Monte-Carlo realizations. The vertical dashed line corresponds to the parameter p0 = 18.5% (![]() ) of this dust model.
) of this dust model.
Current usage metrics show cumulative count of Article Views (full-text article views including HTML views, PDF and ePub downloads, according to the available data) and Abstracts Views on Vision4Press platform.
Data correspond to usage on the plateform after 2015. The current usage metrics is available 48-96 hours after online publication and is updated daily on week days.
Initial download of the metrics may take a while.