Free Access
Fig. 5
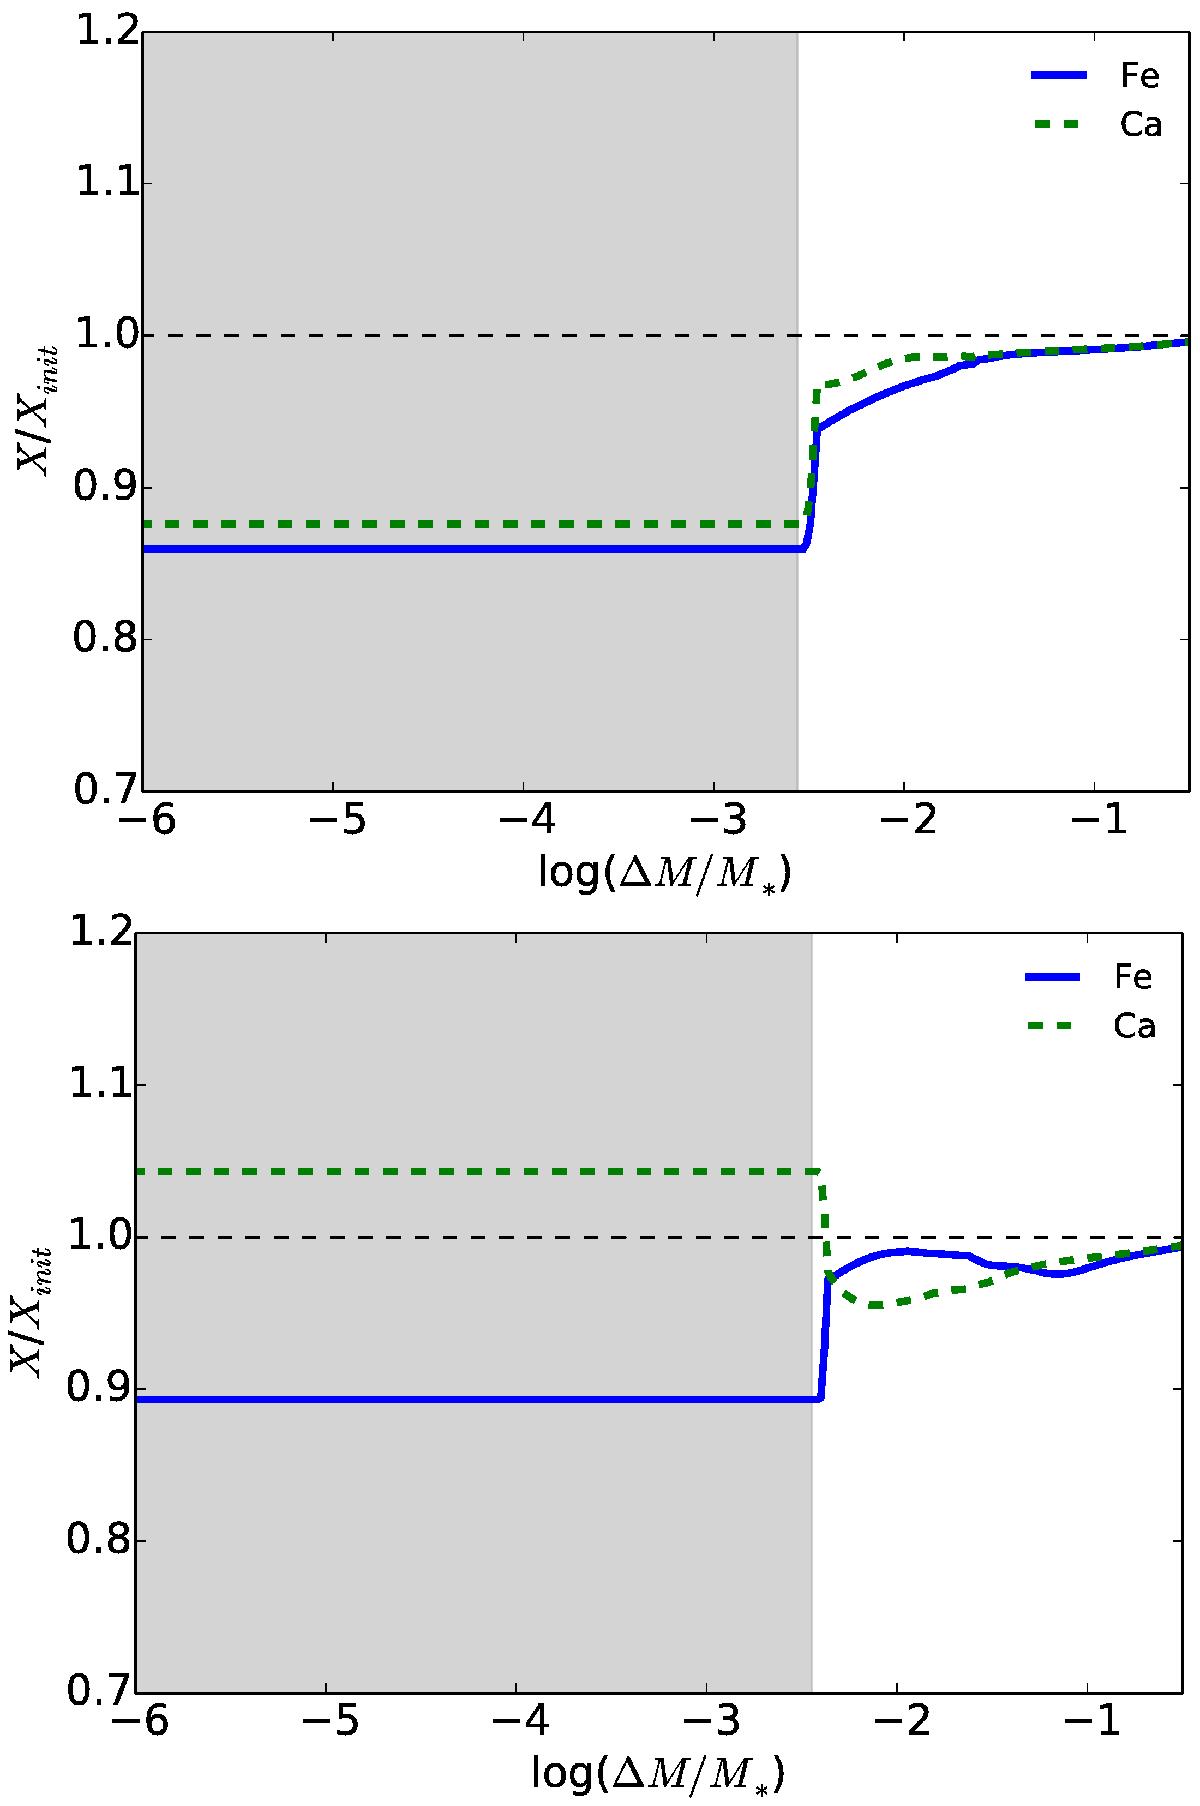
Abundance profiles of calcium (green dashed lines) and iron (blue solid lines) for the model of 1.44 M⊙ with Yinit = 0.297 and Zinit = 0.0305 with gravitational settling only (upper panel) and including radiative acceleration (lower panel). The dark grey areas represent the surface convective zone.
This figure is made of several images, please see below:
Current usage metrics show cumulative count of Article Views (full-text article views including HTML views, PDF and ePub downloads, according to the available data) and Abstracts Views on Vision4Press platform.
Data correspond to usage on the plateform after 2015. The current usage metrics is available 48-96 hours after online publication and is updated daily on week days.
Initial download of the metrics may take a while.