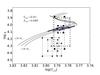
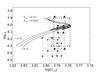
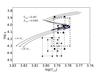
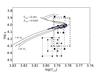
Fig. 2
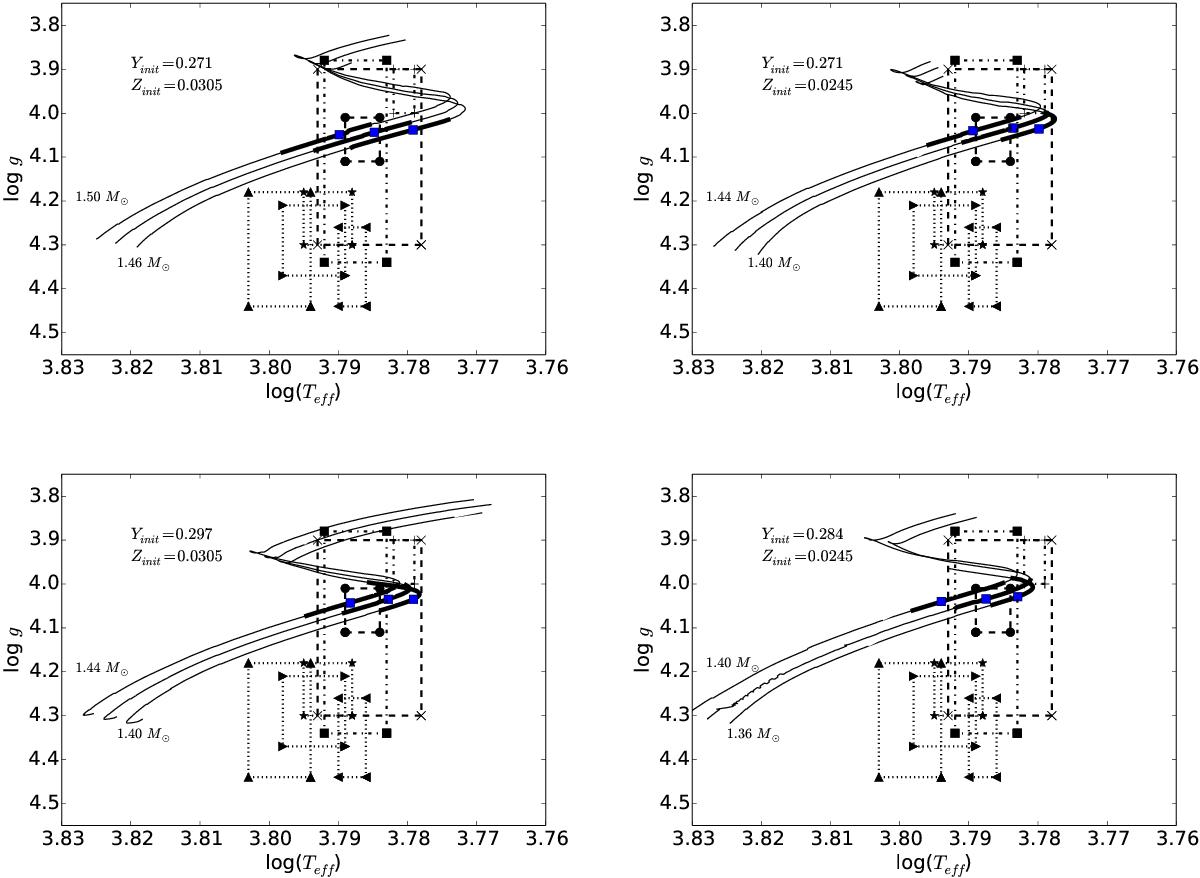
log g vs. Teff diagrams for models with four different initial chemical compositions. The masses range between 1.36 and 1.5 M⊙. The error boxes come from the spectroscopic studies detailed in Sect. 2.1 and Table 1. The crosses correspond to Edvardsson et al. (1993), the pluses correspond to Smith et al. (2001), the right triangles correspond to Santos et al. (2004) (CORALIE), the triangles correspond to Santos et al. (2004) (FEROS), the dots correspond to Santos et al. (2004) (UVES), the squares correspond to Santos et al. (2004) (UES), the stars correspond to Valenti & Fischer (2005) and the left triangles correspond to Maldonado et al. (2012). The blue squares represent the models with the same mean large separation as the one determined from the seismic observations. The heavy line segments correspond to models consistent with the interferometric radius.
Current usage metrics show cumulative count of Article Views (full-text article views including HTML views, PDF and ePub downloads, according to the available data) and Abstracts Views on Vision4Press platform.
Data correspond to usage on the plateform after 2015. The current usage metrics is available 48-96 hours after online publication and is updated daily on week days.
Initial download of the metrics may take a while.