Fig. 7
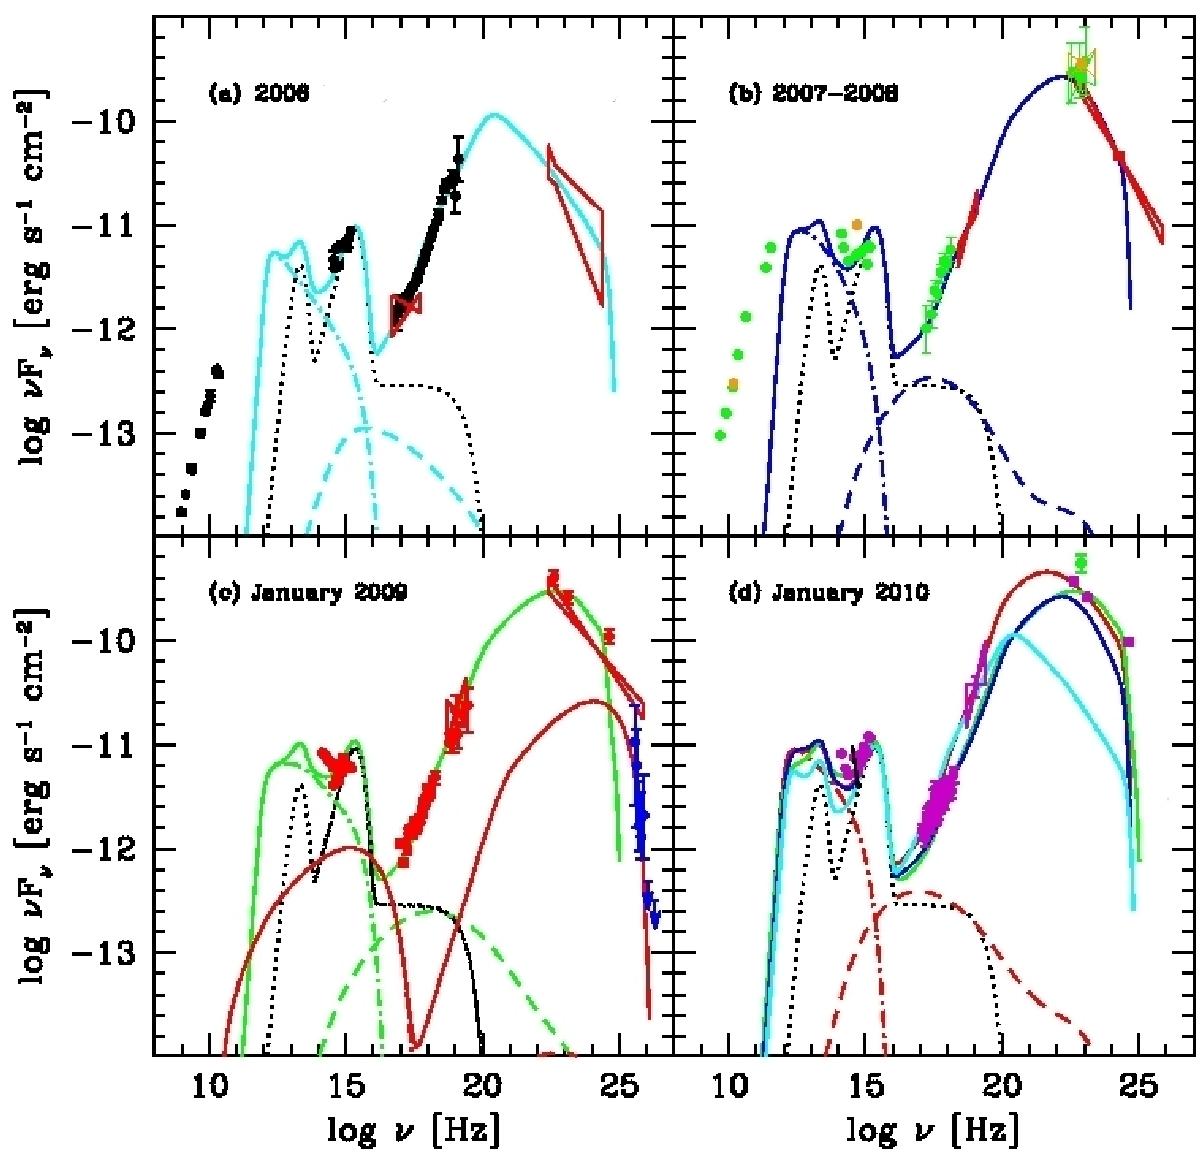
Simultaneous or quasi-simultaneous multiwavelength spectra of PKS 1510–089 at different epochs in the rest frame. Soft X-ray data and ultraviolet-to-NIR data were corrected for neutral hydrogen absorption (NH = 7 × 1020 cm-2) and dust extinction (EB−V = 0.09) in our Galaxy, respectively. a) The filled black circles are from Kataoka et al. (2008) and refer to August 2006. Red bow-ties are archival data from ROSAT (Siebert et al. 1996), and CGRO-EGRET (>100 MeV, Apr. 1991–Nov. 1992, Hartman et al. 1999). b) Orange symbols are AGILE-GRID and GASP data obtained during 27 Aug.–1 Sep. 2007 (Pucella et al. 2008). Light green symbols are AGILE-GRID, GASP, Swift UVOT, and Swift XRT data of March 2008 (D’Ammando et al. 2009). The red bow-tie at hard X-ray frequencies corresponds to the INTEGRAL spectrum in Jan. 2008 (Barnacka & Moderski 2009). The red bow-tie at gamma-ray frequencies corresponds to Fermi-LAT observations during Aug.–Oct. 2008 (Abdo et al. 2009). c) Red symbols refer to optical data from NOT (13 and 18 Jan. 2009); Swift XRT and UVOT (10–25 Jan. 2009, Abdo et al. 2010c); INTEGRAL IBIS-ISGRI (13–24 Jan. 2009); Fermi-LAT data (10 Jan.–1 Feb. 2009). Blue symbols are HESS observations in March 2009 (HESS Collaboration 2013); upper limits at 3σ confidence for the two highest-energy bands are reported. d) Magenta symbols refer to optical data from NOT (23 Jan. 2010) and Swift/UVOT (15, 17, and 19 Jan. 2010); Swift XRT (15–19 Jan. 2010), INTEGRAL IBIS-ISGRI (17–19 Jan. 2010); and Fermi-LAT (26 Dec. 2009–23 Jan. 2010). The green symbol is the E > 100 MeV gamma-ray observation from AGILE (11–13 Jan. 2010, Striani et al. 2010). The black solid segment shows the polarized NOT spectrum of 18 Jan. 2010. Fluxes have been multiplied by a constant factor of 50. In each panel, we report the curves obtained from a fit of the SEDs with the blazar model (Ghisellini & Tavecchio 2009). The black dotted curve represents a thermal component that is assumed to be constant in time and consisting of radiation from an accretion disk (optical-ultraviolet), a torus (FIR) and a corona (X-rays, with an exponential cutoff at ~100 keV). The dot-dashed curve shows the synchrotron emission component. The dashed curve represents first and second order synchrotron self-Compton process. Most of the inverse Compton scattering occurs off external BLR photons (this individual component is not shown). The sum of the thermal and non-thermal components is shown as a single curve in each panel: cyan in a); blue in b); green in c) and red in d); where we report also the best-fit curves for the 3 previous epochs. The quasi-simultaneous VHE emission of Mar 2009 is modeled independently by external Compton of infrared photons of the torus. The sum of this component and the synchrotron emission is shown in c) as solid red curve.
Current usage metrics show cumulative count of Article Views (full-text article views including HTML views, PDF and ePub downloads, according to the available data) and Abstracts Views on Vision4Press platform.
Data correspond to usage on the plateform after 2015. The current usage metrics is available 48-96 hours after online publication and is updated daily on week days.
Initial download of the metrics may take a while.