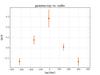
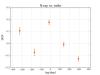
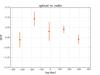
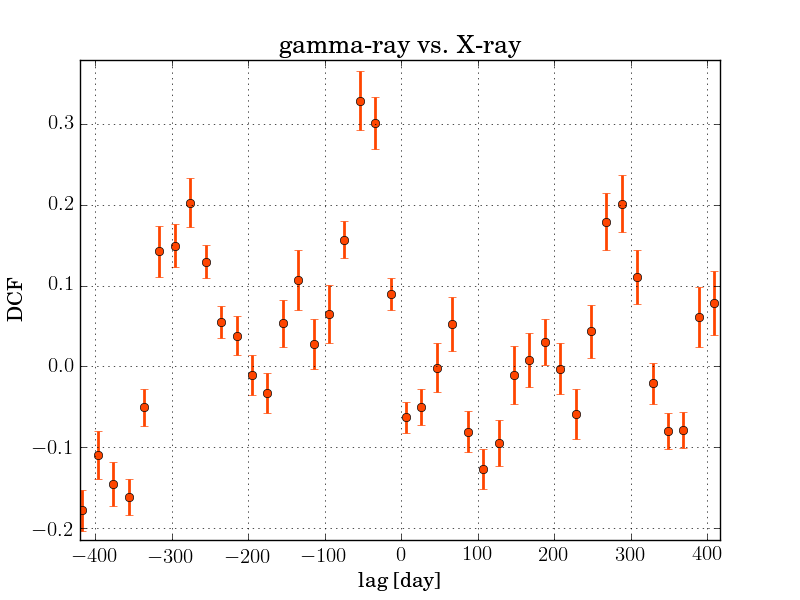
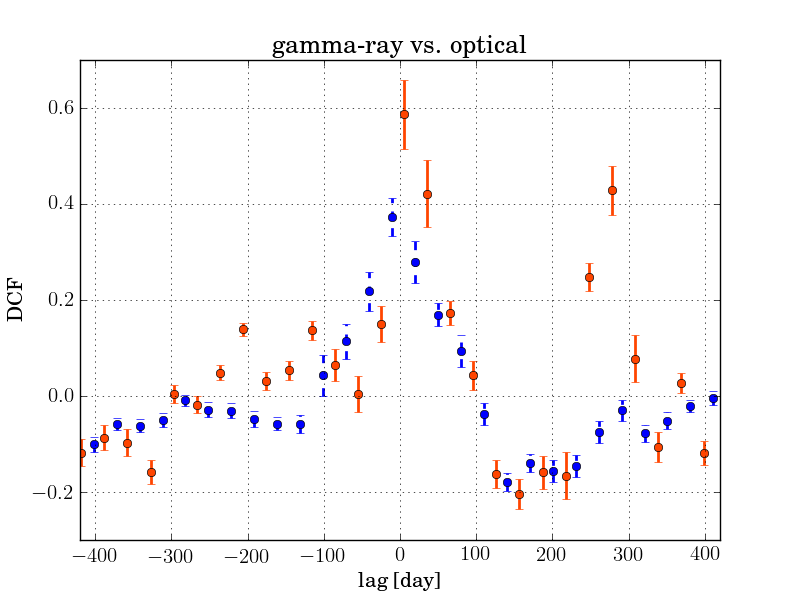
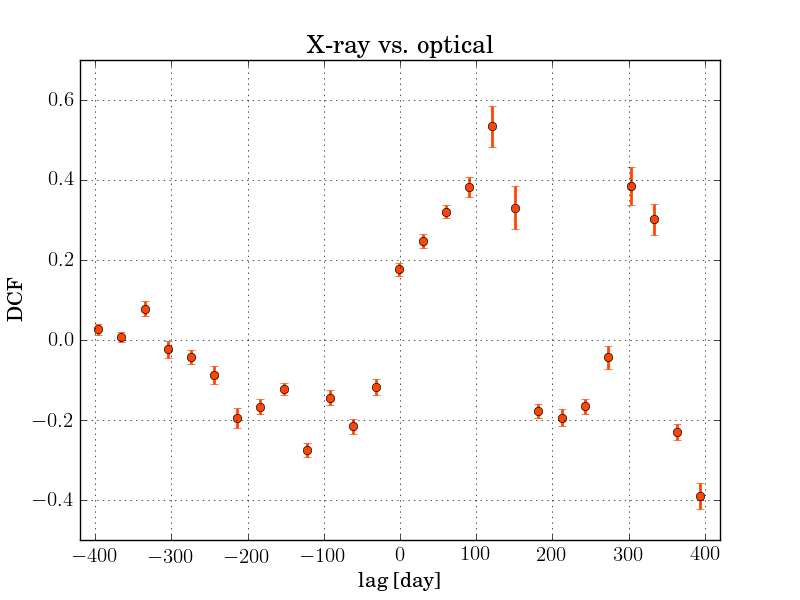
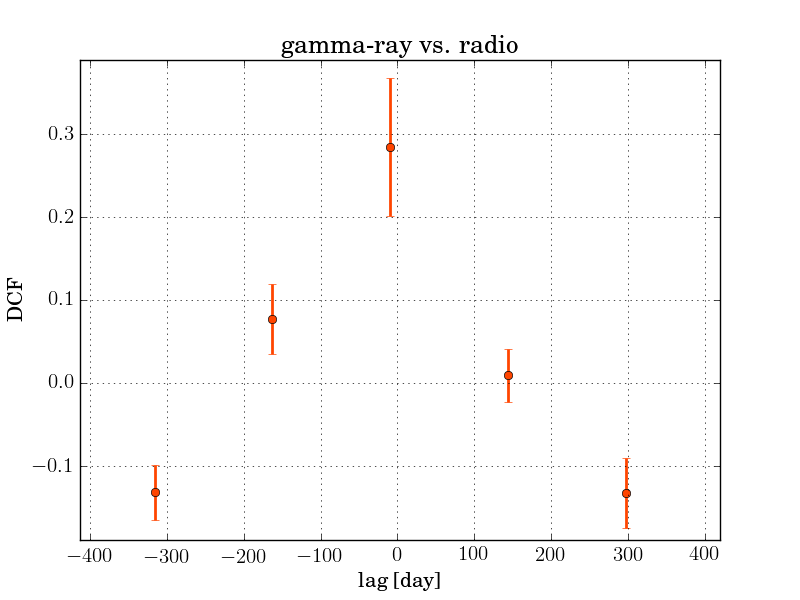
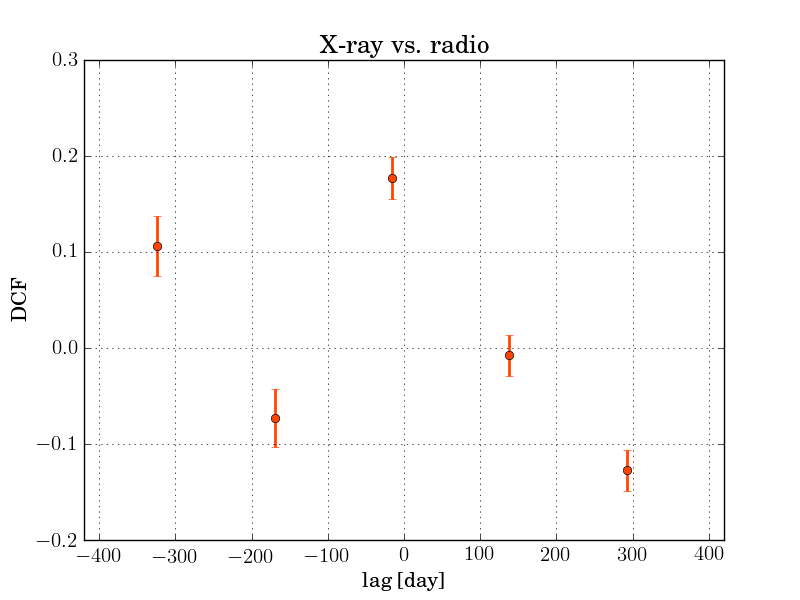
Fig. 4
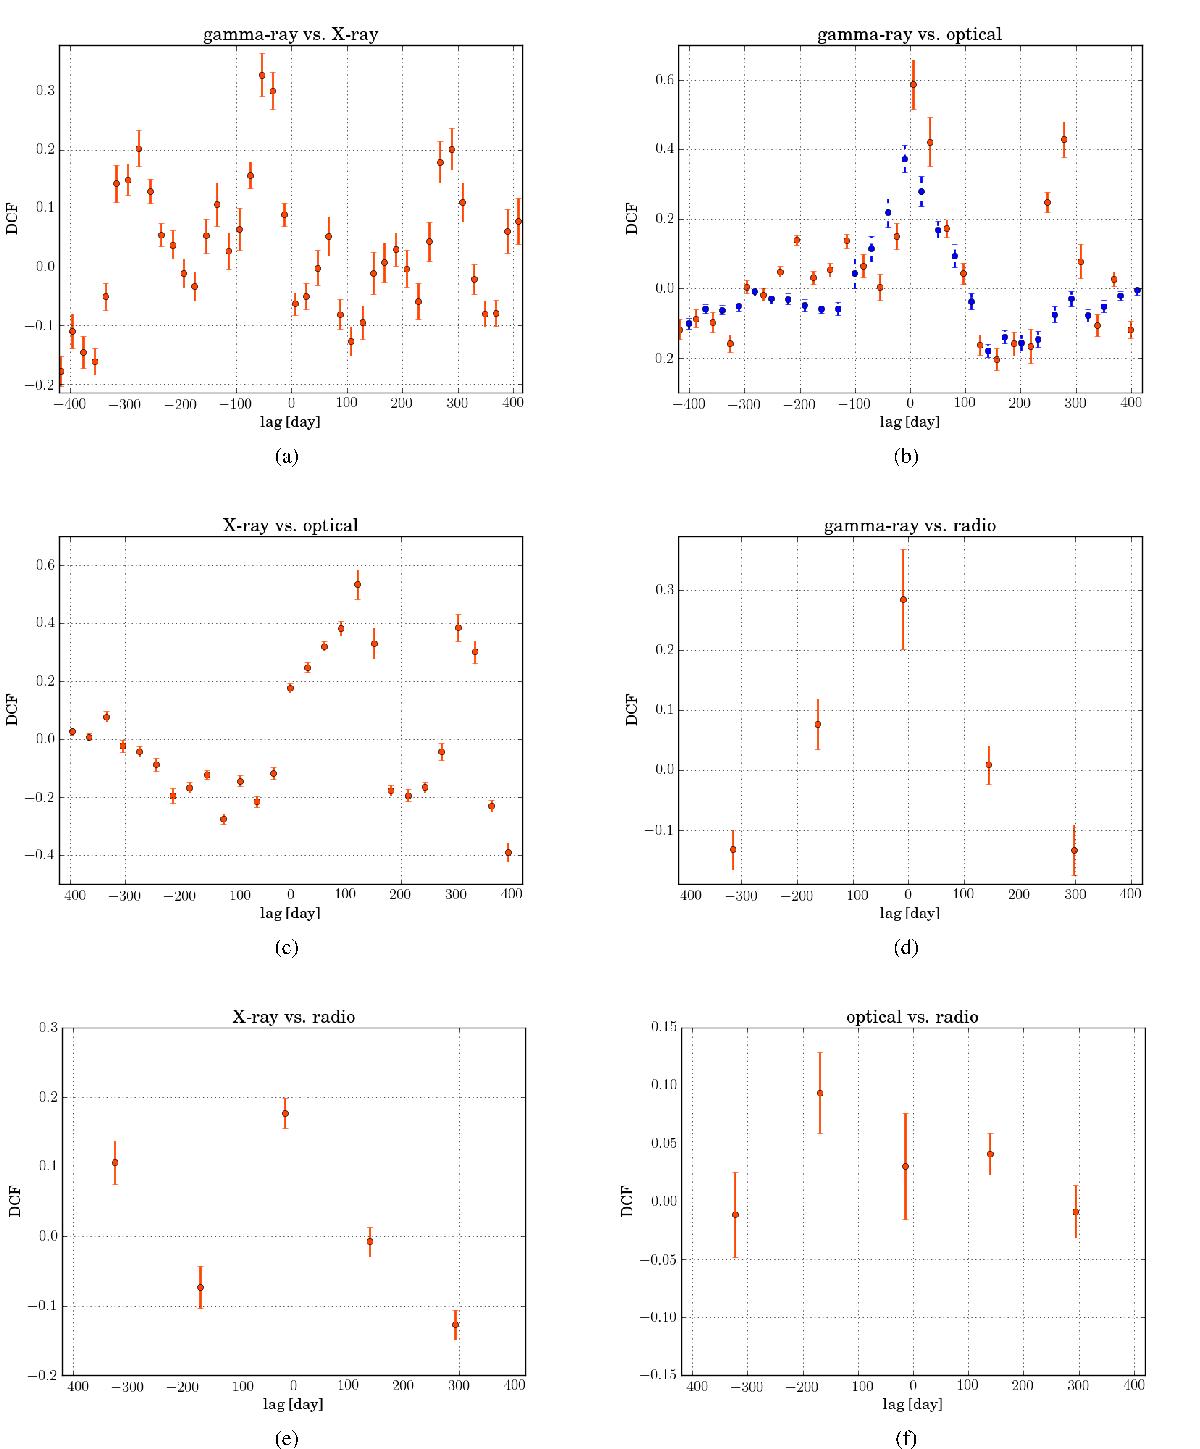
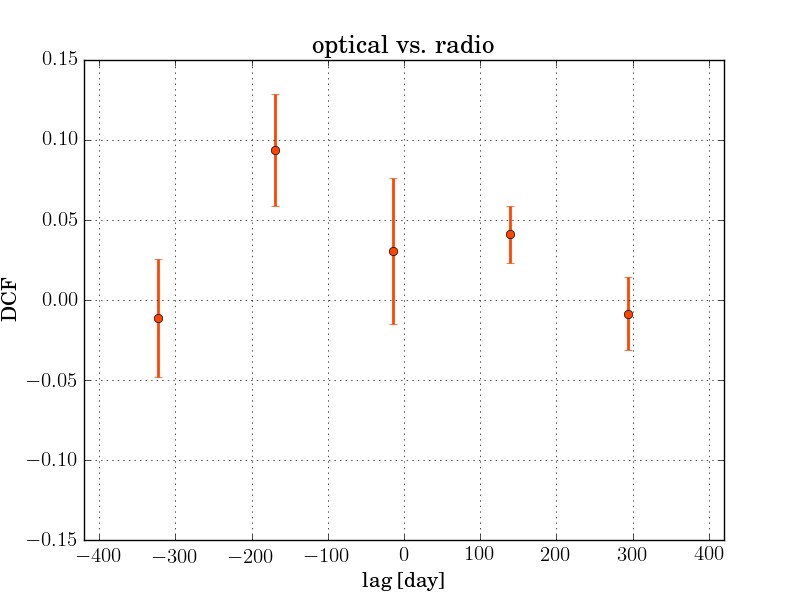
DCF curves between pairs of gamma-ray (Fermi-LAT, 0.1–300 GeV), X-ray (RXTE PCA, 2–15 keV), optical (Steward Observatory V-band), and radio (15 GHz) light curves considered in their common time range, i.e., between 4411.5 and 5508.1 days from 1 Dec. 1996 (orange circles and solid error bars). In panel b), we have reported as blue circles and dashed error bars also the DCF obtained by considering the optical and gamma-ray light curves within their maximum common time range, i.e., between 4411.5 and 7175.2 days from 1 Dec. 1996. The reported errors are the statistical 1σ uncertainties. The DCF time bin adopted is equal to 20 days a), 30 days (b), c)), and 150 days (d), e), f)) and it is approximately equal to three times the mean time separation between consecutive observations of the light curve with the worse sampling. In each panel positive time lags correspond to variations of the lower-energy light curve preceding those of the higher-energy light curve.
Current usage metrics show cumulative count of Article Views (full-text article views including HTML views, PDF and ePub downloads, according to the available data) and Abstracts Views on Vision4Press platform.
Data correspond to usage on the plateform after 2015. The current usage metrics is available 48-96 hours after online publication and is updated daily on week days.
Initial download of the metrics may take a while.