Fig. 2
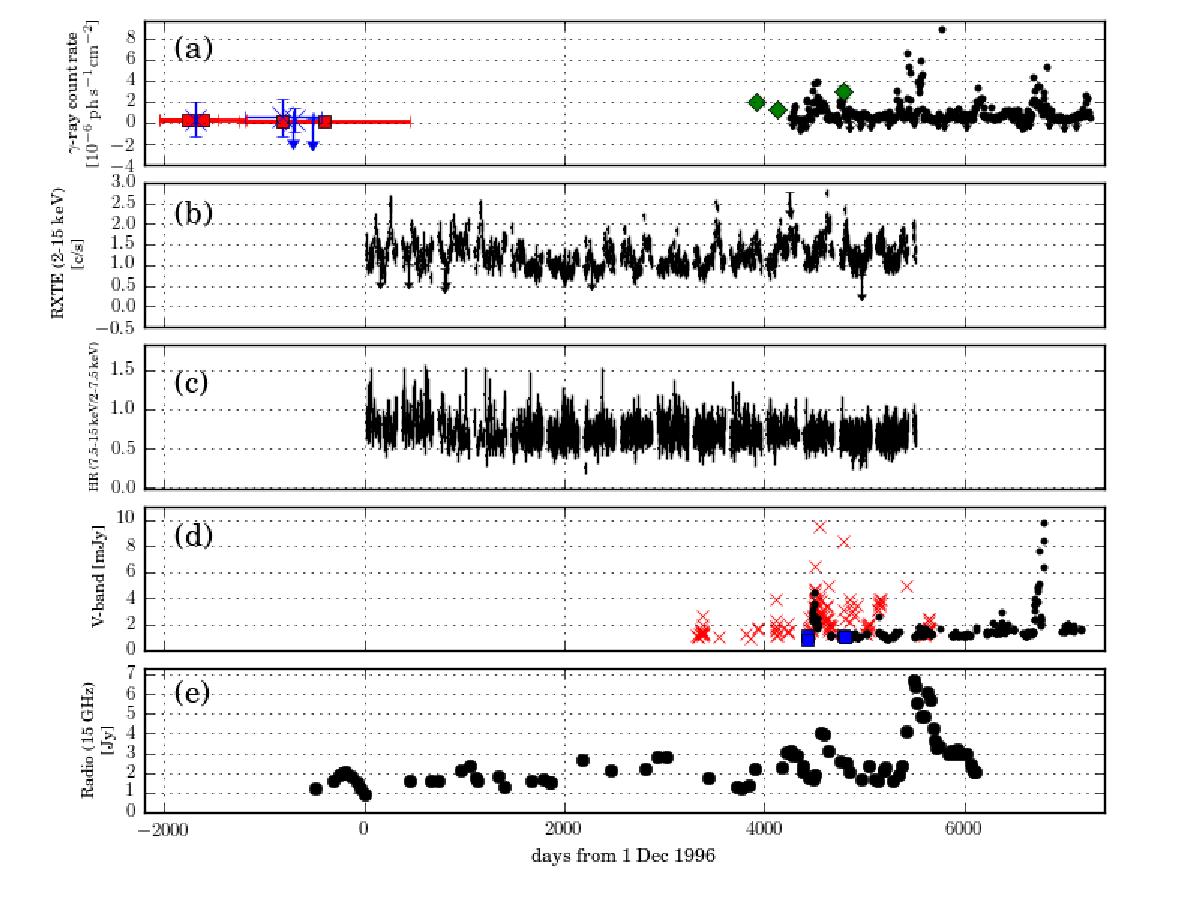
Historical light curves in observer frame. a) Gamma-ray light curve. The small filled circles (black) represent the Fermi-LAT (0.1–300 GeV) weekly-binned light curve; the 90% confidence upper limits are also reported; crosses and big upper limits (blue) represent the CGRO-EGRET (>100 MeV) fluxes from 3rd EGRET catalog (Hartman et al. 1999); squares (red) are the CGRO-EGRET fluxes from the revised EGRET catalog (Casandjian & Grenier 2008); diamonds (green) are AGILE-GRID (>100 MeV) detections (Pucella et al. 2008; D’Ammando et al. 2009; Striani et al. 2010). b) X-ray Rossi XTE light curve (2–15 keV) and 3σ upper limits.The average (median) separation between consecutive observations, once upper limits are removed, is 4.2 ± 6.5 days (3.4 days). The reported uncertainty is the rms dispersion. c) X-ray Rossi XTE hardness ratio(7.5–15 keV vs. 2–7.5 keV channels). d) Optical V-band historical light curve, corrected for Galactic dust absorption (EB−V = 0.09, Schlafly & Finkbeiner 2011), using the extinction curve from Cardelli et al. (1989). The REM observations (red crosses) are from (Sandrinelli et al. 2014a); the black circles represent photometry obtained at the Steward Observatory (Smith et al. 2009); the blue squares are our NOT data (Table 3). e) Radio VLBA I-band (15 GHz) light curve from the MOJAVE database (Lister et al. 2009).
Current usage metrics show cumulative count of Article Views (full-text article views including HTML views, PDF and ePub downloads, according to the available data) and Abstracts Views on Vision4Press platform.
Data correspond to usage on the plateform after 2015. The current usage metrics is available 48-96 hours after online publication and is updated daily on week days.
Initial download of the metrics may take a while.