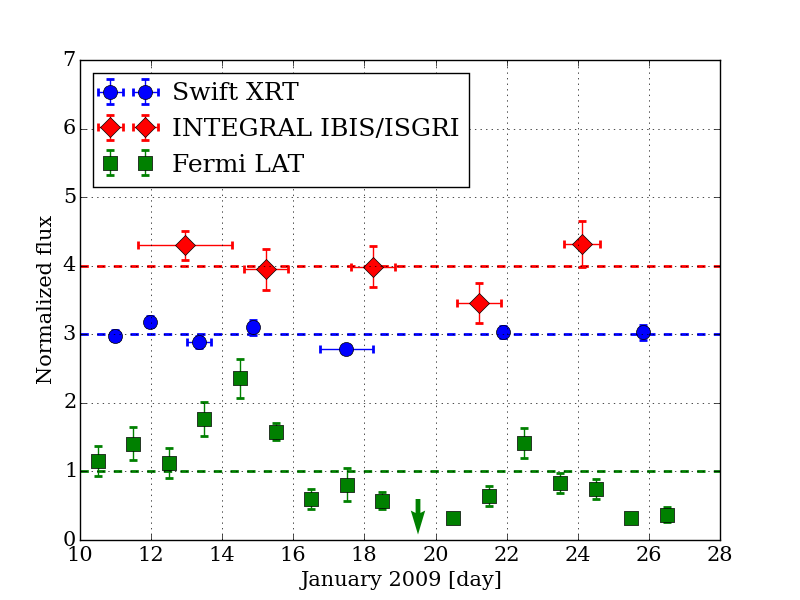
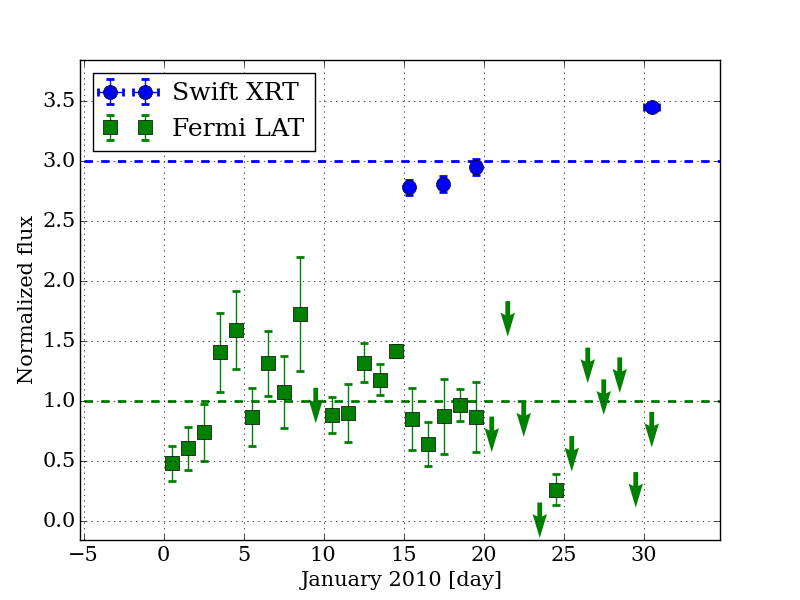
Fig. 1
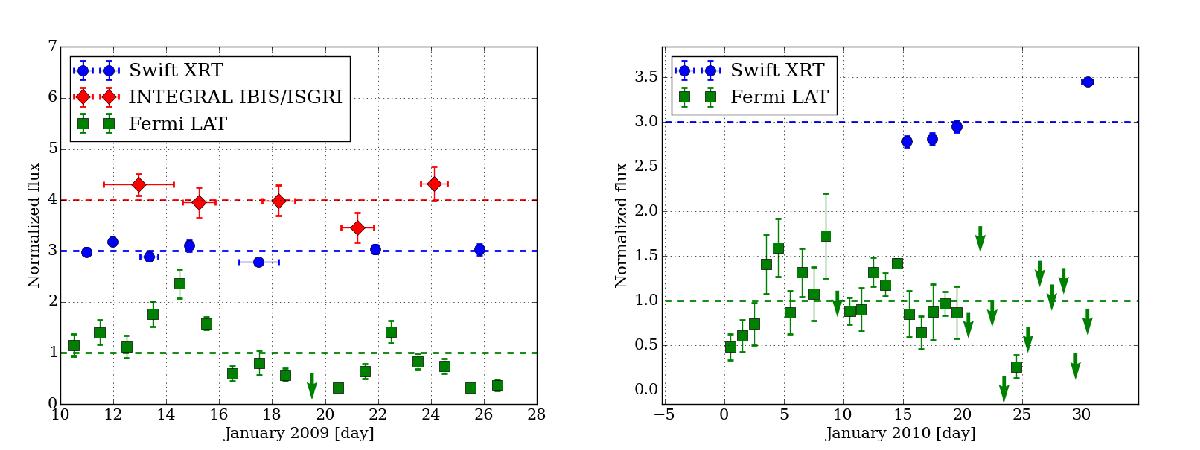
Normalized light curves in observer frame during Jan. 2009 (left) and Jan. 2010 (right). Swift XRT (0.3–10 keV) data, corrected for Galactic HI absorption, are filled circles (blue); diamonds (red) are INTEGRAL IBIS/ISGRI (20–100 keV) data; squares (green) represent the Fermi-LAT (0.1–300 GeV) data daily-binned light curves, including 90% upper limits. All light curves are normalized with respect to their mean (computed without considering upper limits).For each light curve the dashed horizontal line shows the average normalized flux. Swift XRT and INTEGRAL normalized light curves are shifted up by constants two and three, respectively.
Current usage metrics show cumulative count of Article Views (full-text article views including HTML views, PDF and ePub downloads, according to the available data) and Abstracts Views on Vision4Press platform.
Data correspond to usage on the plateform after 2015. The current usage metrics is available 48-96 hours after online publication and is updated daily on week days.
Initial download of the metrics may take a while.