Fig. 9
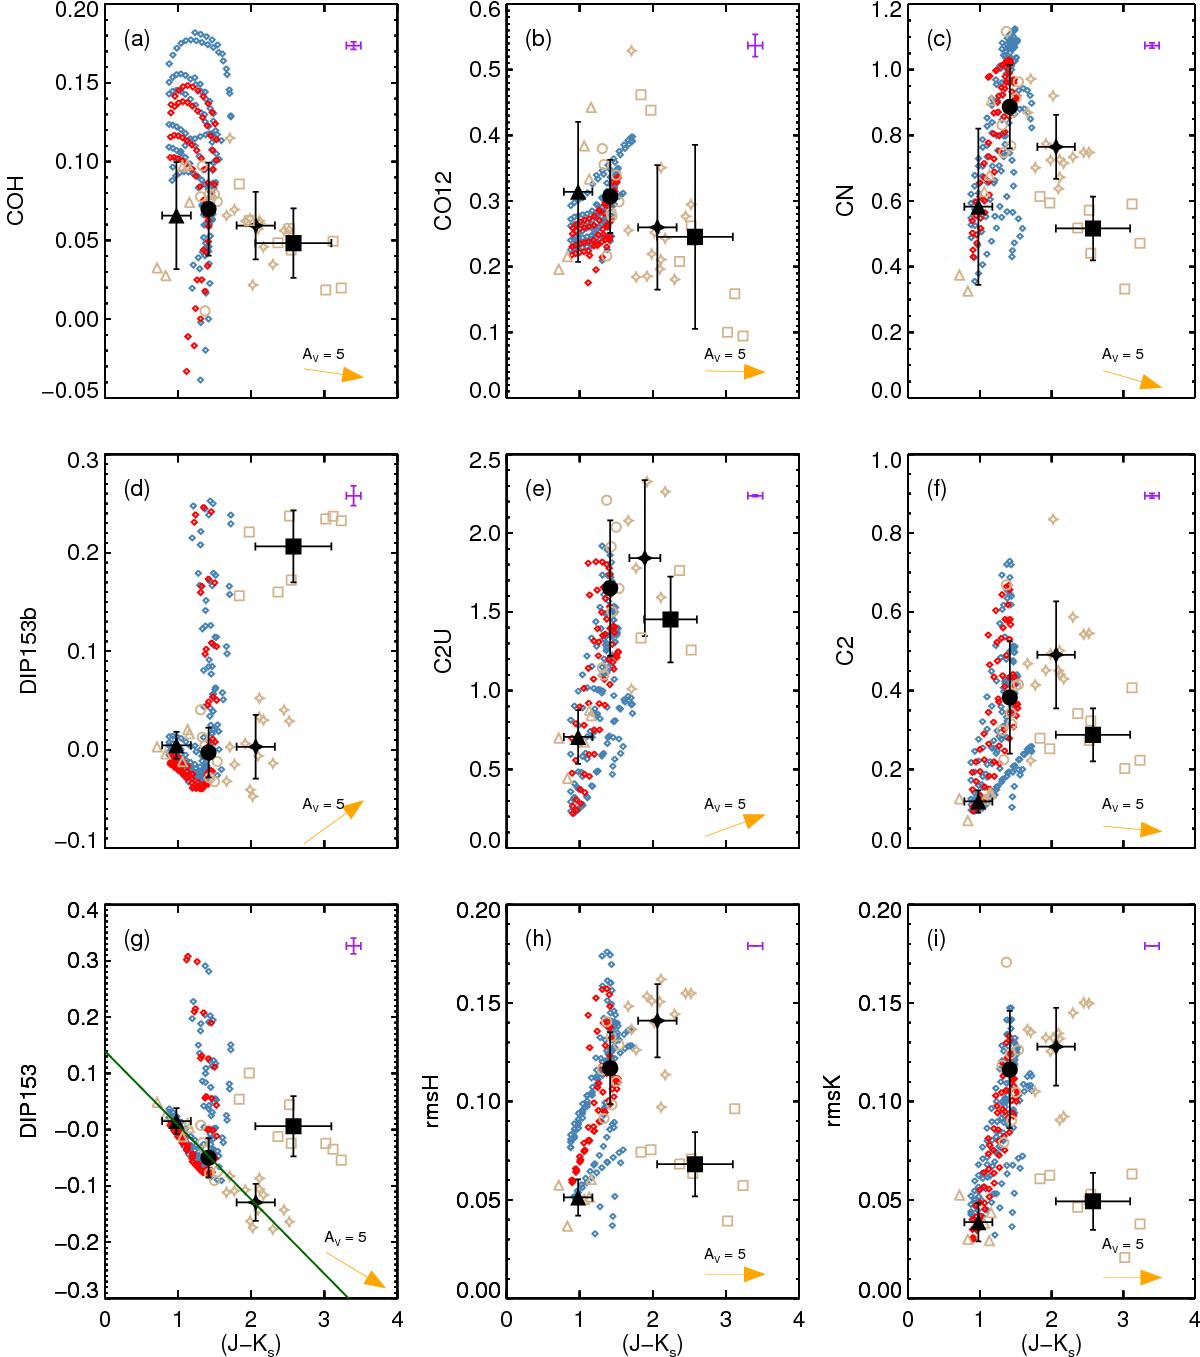
Spectro-photometric indices derived for our sample of carbon stars (brown symbols) and the grid of models (color symbols) as a function of (J−Ks). The triangles are for stars from Group A, the circles for Group B, the stars for Group, C and the squares for Group D. The filled symbols represent the averaged values of our indices in the groups, and the bars measure the dispersion within the bin. The open diamonds represent the models of solar (in blue) and subsolar metalliticity (red). The models were smoothed to R ≃ 8000 for the purpose of this figure. Typical uncertainties on individual measurements are shown in purple. The orange vector represents the extinction vector (computed for AV = 5). In panel g), the green line was used to define the new index DIP153b (see Eq. (1)).
Current usage metrics show cumulative count of Article Views (full-text article views including HTML views, PDF and ePub downloads, according to the available data) and Abstracts Views on Vision4Press platform.
Data correspond to usage on the plateform after 2015. The current usage metrics is available 48-96 hours after online publication and is updated daily on week days.
Initial download of the metrics may take a while.