Free Access
Fig. 6
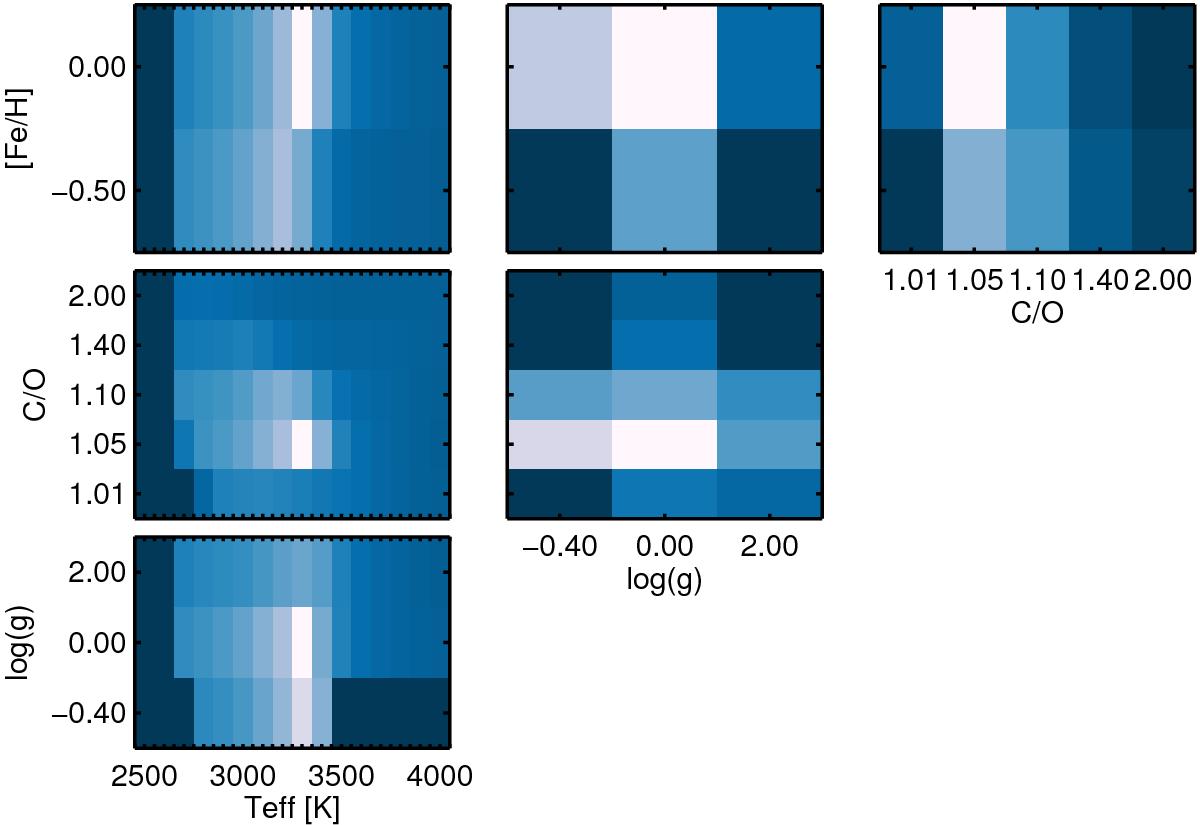
Example of χ2 maps for one of our pseudo-observations (Teff = 3300 K, log (g) = 0, C/O = 1.05, [Fe/H] = 0) for the VIS wavelength range. The best values (i.e., the values that minimize the χ2 calculation) are represented in white.
Current usage metrics show cumulative count of Article Views (full-text article views including HTML views, PDF and ePub downloads, according to the available data) and Abstracts Views on Vision4Press platform.
Data correspond to usage on the plateform after 2015. The current usage metrics is available 48-96 hours after online publication and is updated daily on week days.
Initial download of the metrics may take a while.