Fig. B.1
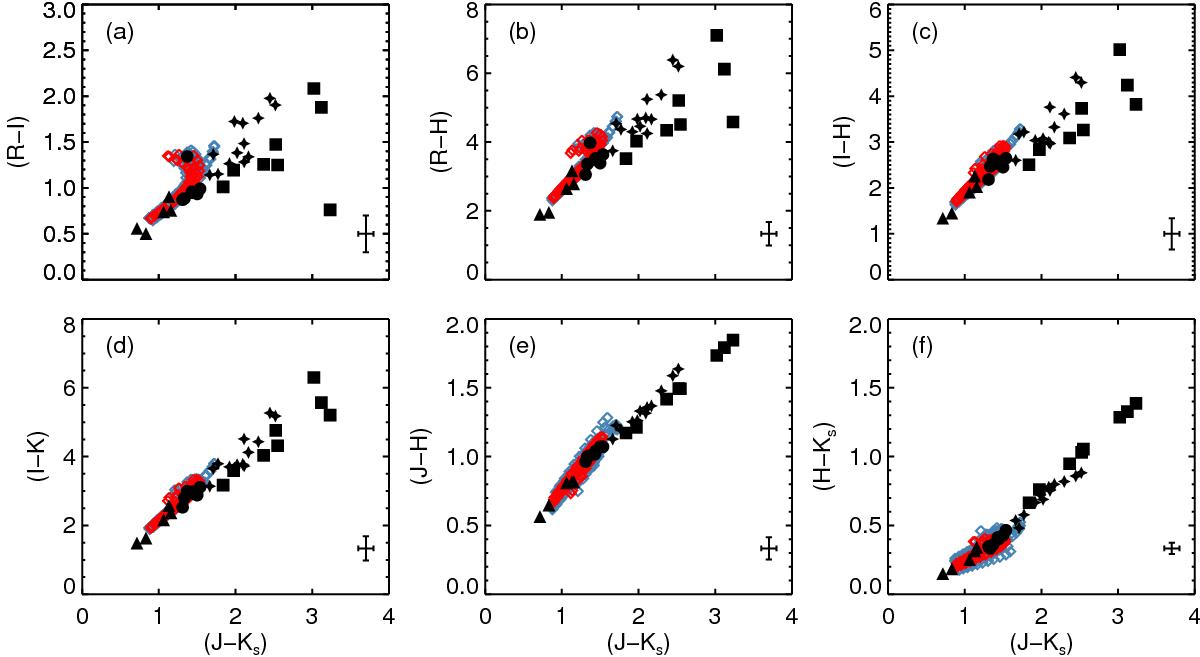
Some color–color plots containing our sample of observed carbon stars (black symbols) and the models (colored diamonds). The triangles are for stars from Group A, the circles for Group B, the stars for Group C, and the squares for Group D. The open diamonds represent the models at solar (in blue) and subsolar metalliticity (red). The bars show the ± 1σ root-mean-square deviation of our photometry with respect to the literature (large-amplitude variables excluded). This is an upper limit of the uncertainties in the flux calibration and any possible residual variability.
Current usage metrics show cumulative count of Article Views (full-text article views including HTML views, PDF and ePub downloads, according to the available data) and Abstracts Views on Vision4Press platform.
Data correspond to usage on the plateform after 2015. The current usage metrics is available 48-96 hours after online publication and is updated daily on week days.
Initial download of the metrics may take a while.