Fig. A.1
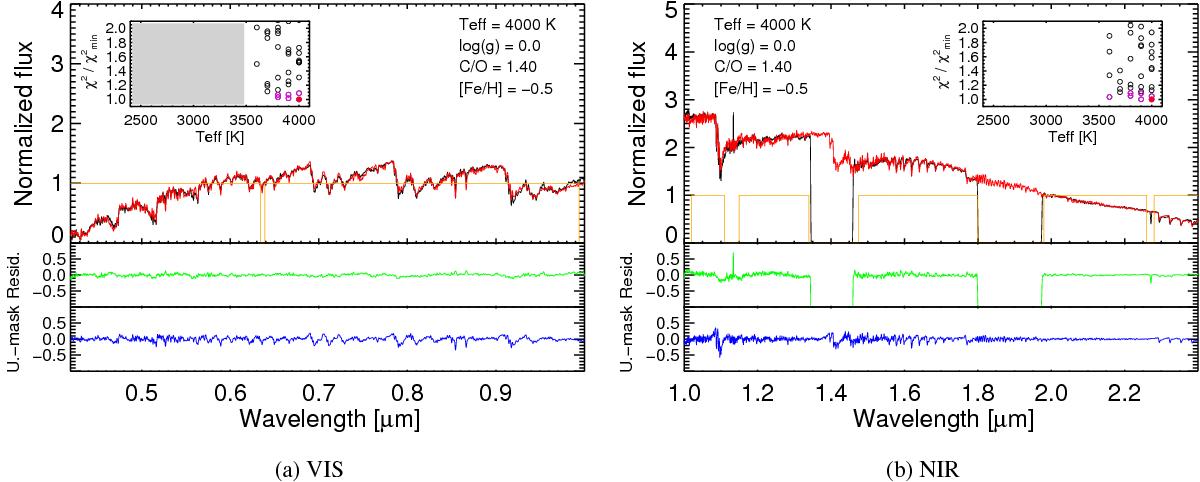
Best-fitting models for Cl* NGC 121 T V8 (Group A). For each observation, the upper panel shows the stellar spectrum as a black curve and the best model times the best-fitting polynomial as a red curve. The weights applied for the χ2 minimization are displayed in orange. The middle panel shows the residuals (in green), while the bottom panel shows an unsharp-mask filtered version of the best-model spectrum (in blue). In addition, a small inset shows the output ![]() values as a function of the temperatures of the input models. The gray-shaded area masks the models excluded from the fitting in order to avoid unphysical dereddening of the models. The red solid point corresponds to the best model, while the magenta points are for the range of models considered similarly acceptable. Note that some of the VIS spectra lack data around 0.63 μm, e.g., Fig. A.4. This results from the bad columns in the VIS arm of the X-shooter (an artifact restricted to data taken in the ESO semester P84).
values as a function of the temperatures of the input models. The gray-shaded area masks the models excluded from the fitting in order to avoid unphysical dereddening of the models. The red solid point corresponds to the best model, while the magenta points are for the range of models considered similarly acceptable. Note that some of the VIS spectra lack data around 0.63 μm, e.g., Fig. A.4. This results from the bad columns in the VIS arm of the X-shooter (an artifact restricted to data taken in the ESO semester P84).
Current usage metrics show cumulative count of Article Views (full-text article views including HTML views, PDF and ePub downloads, according to the available data) and Abstracts Views on Vision4Press platform.
Data correspond to usage on the plateform after 2015. The current usage metrics is available 48-96 hours after online publication and is updated daily on week days.
Initial download of the metrics may take a while.