Free Access
Fig. 12
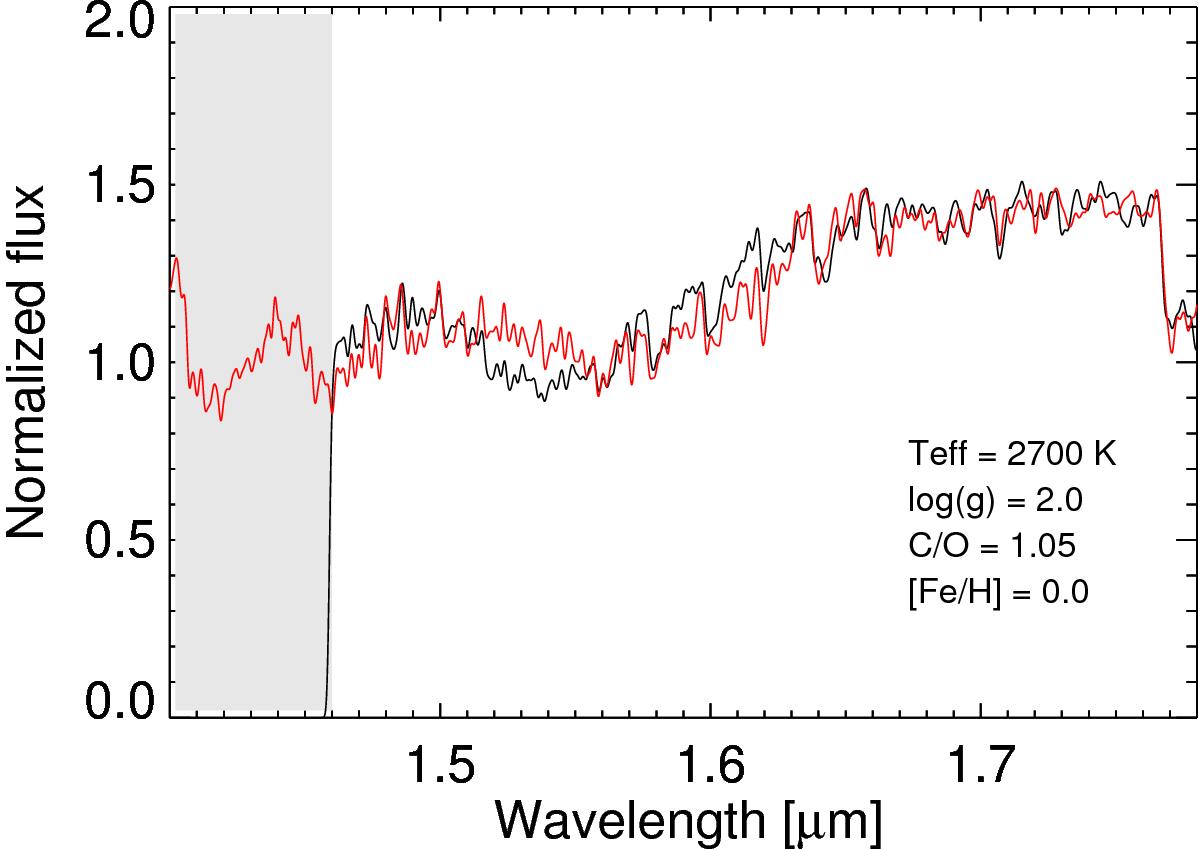
Close-up of the HCN + C2H2 feature at 1.53 μm for SHV 0502469-692418 (cf. Fig. A.25 for full fitting). The black curve corresponds to the stellar spectrum and the red curve to the best model times the best-fitting polynomial. The gray band masks a region with strong telluric absorption.
Current usage metrics show cumulative count of Article Views (full-text article views including HTML views, PDF and ePub downloads, according to the available data) and Abstracts Views on Vision4Press platform.
Data correspond to usage on the plateform after 2015. The current usage metrics is available 48-96 hours after online publication and is updated daily on week days.
Initial download of the metrics may take a while.