Fig. 3
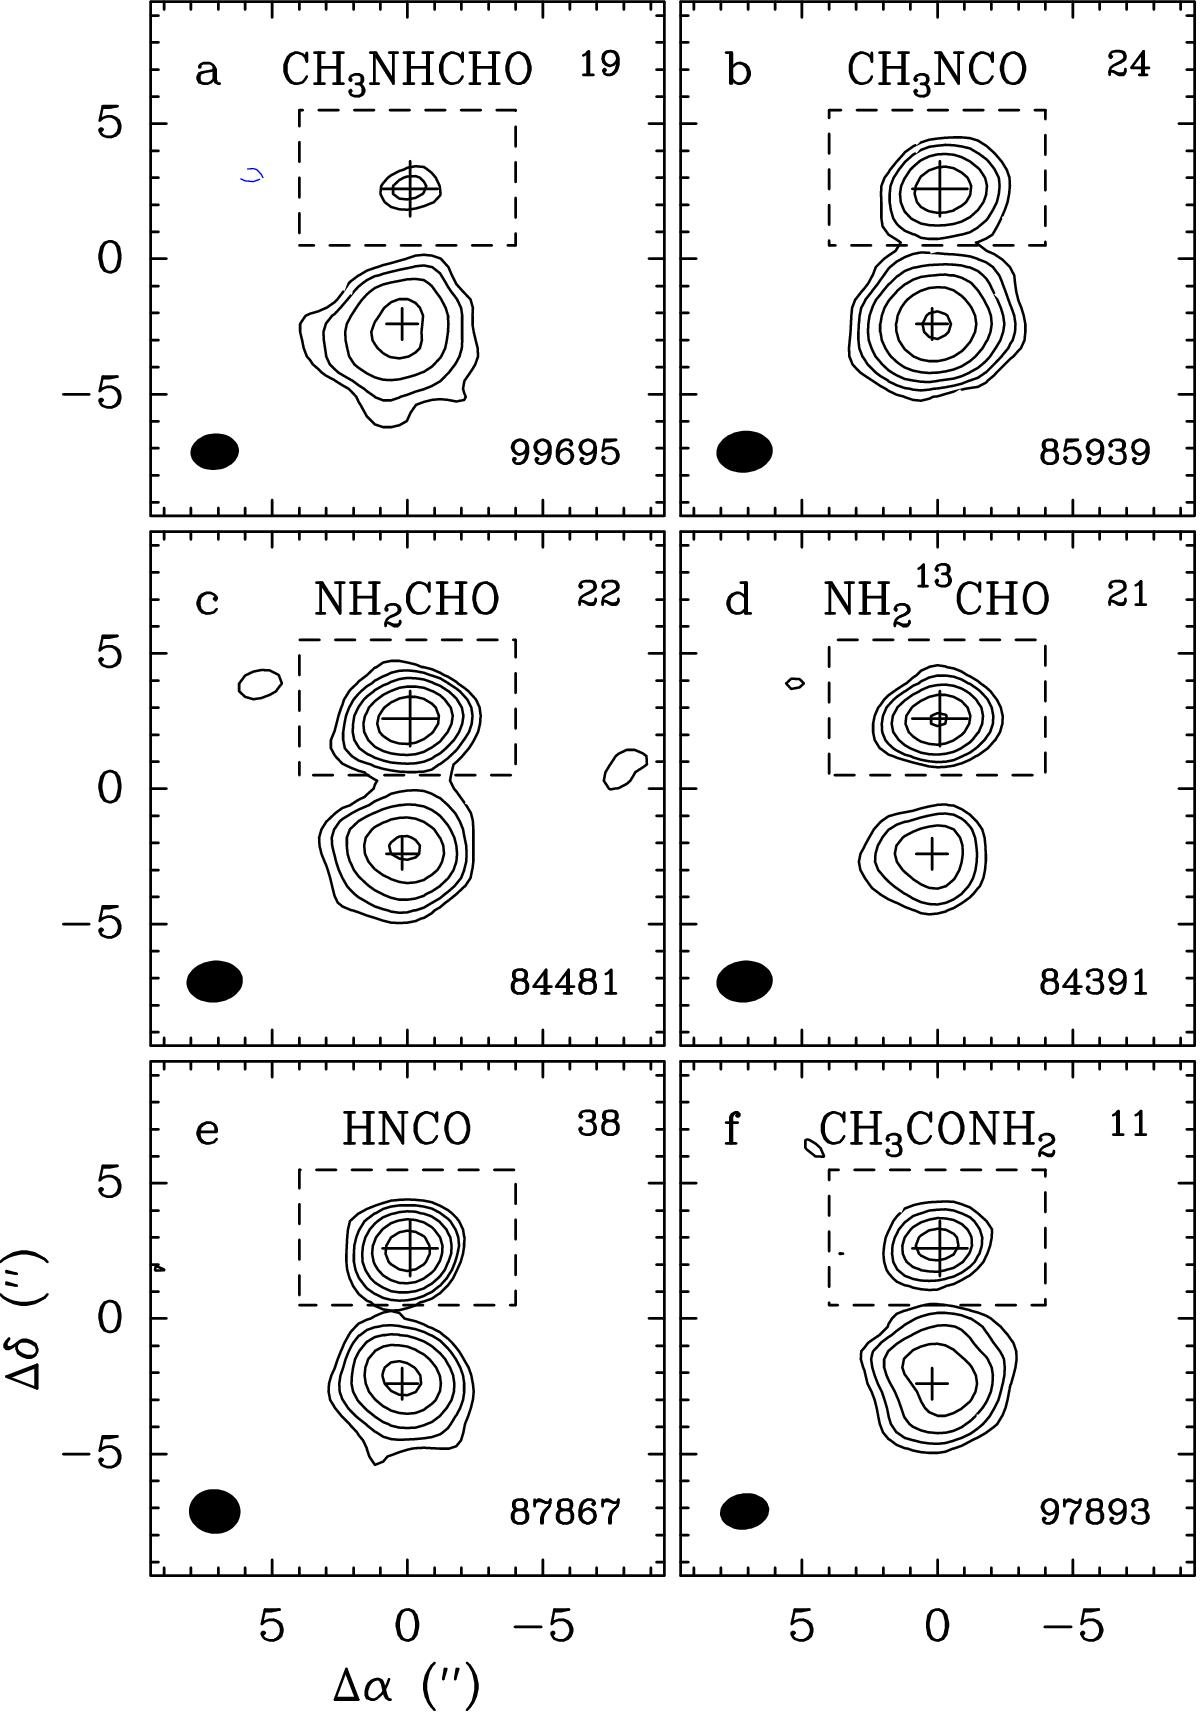
Integrated intensity maps toward Sgr B2(N2) of a) CH3NHCHO 92,8–82,7, b) CH3NCO 101,10–91,9, c) NH2CHO ν12 = 140,4–30,3, d) NH213CHO 40,4–30,3, e) HNCO 43,1–33,0 and 43,2–33,1, and f) CH3CONH290,9–81,8, 91,9–81,8, 90,9–80,8, and 91,9–80,8. The position of Sgr B2(N2) is marked with a large cross. The smaller cross indicates the position of Sgr B2(N1). Because of the different systemic velocities of the two sources, the line assignment is only valid for Sgr B2(N2), inside the dashed box. The contours start at 4σ and increase by a factor of 2 at each step. The dashed (blue) contour is at −4σ. The value of the rms noise level, σ, is given in mJy beam-1 km s-1 in the top right corner of each panel. The mean frequency of the integration range in MHz and the synthesized beam are shown in the bottom right and left corners of each panel, respectively.
Current usage metrics show cumulative count of Article Views (full-text article views including HTML views, PDF and ePub downloads, according to the available data) and Abstracts Views on Vision4Press platform.
Data correspond to usage on the plateform after 2015. The current usage metrics is available 48-96 hours after online publication and is updated daily on week days.
Initial download of the metrics may take a while.