Free Access
Fig. B.1

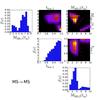
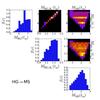
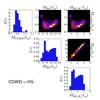
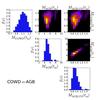
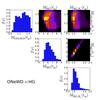
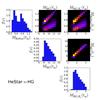
Triangular diagrams show the 1D normalized histograms of the properties of the six main subclasses of late events at the moment of merger (tm) and how they are correlated in the 2D histograms. In Appendix B, we describe the various quantities that are shown. Masses are in units of M⊙ and tfrac is dimensionless.
This figure is made of several images, please see below:
Current usage metrics show cumulative count of Article Views (full-text article views including HTML views, PDF and ePub downloads, according to the available data) and Abstracts Views on Vision4Press platform.
Data correspond to usage on the plateform after 2015. The current usage metrics is available 48-96 hours after online publication and is updated daily on week days.
Initial download of the metrics may take a while.