Fig. A.1
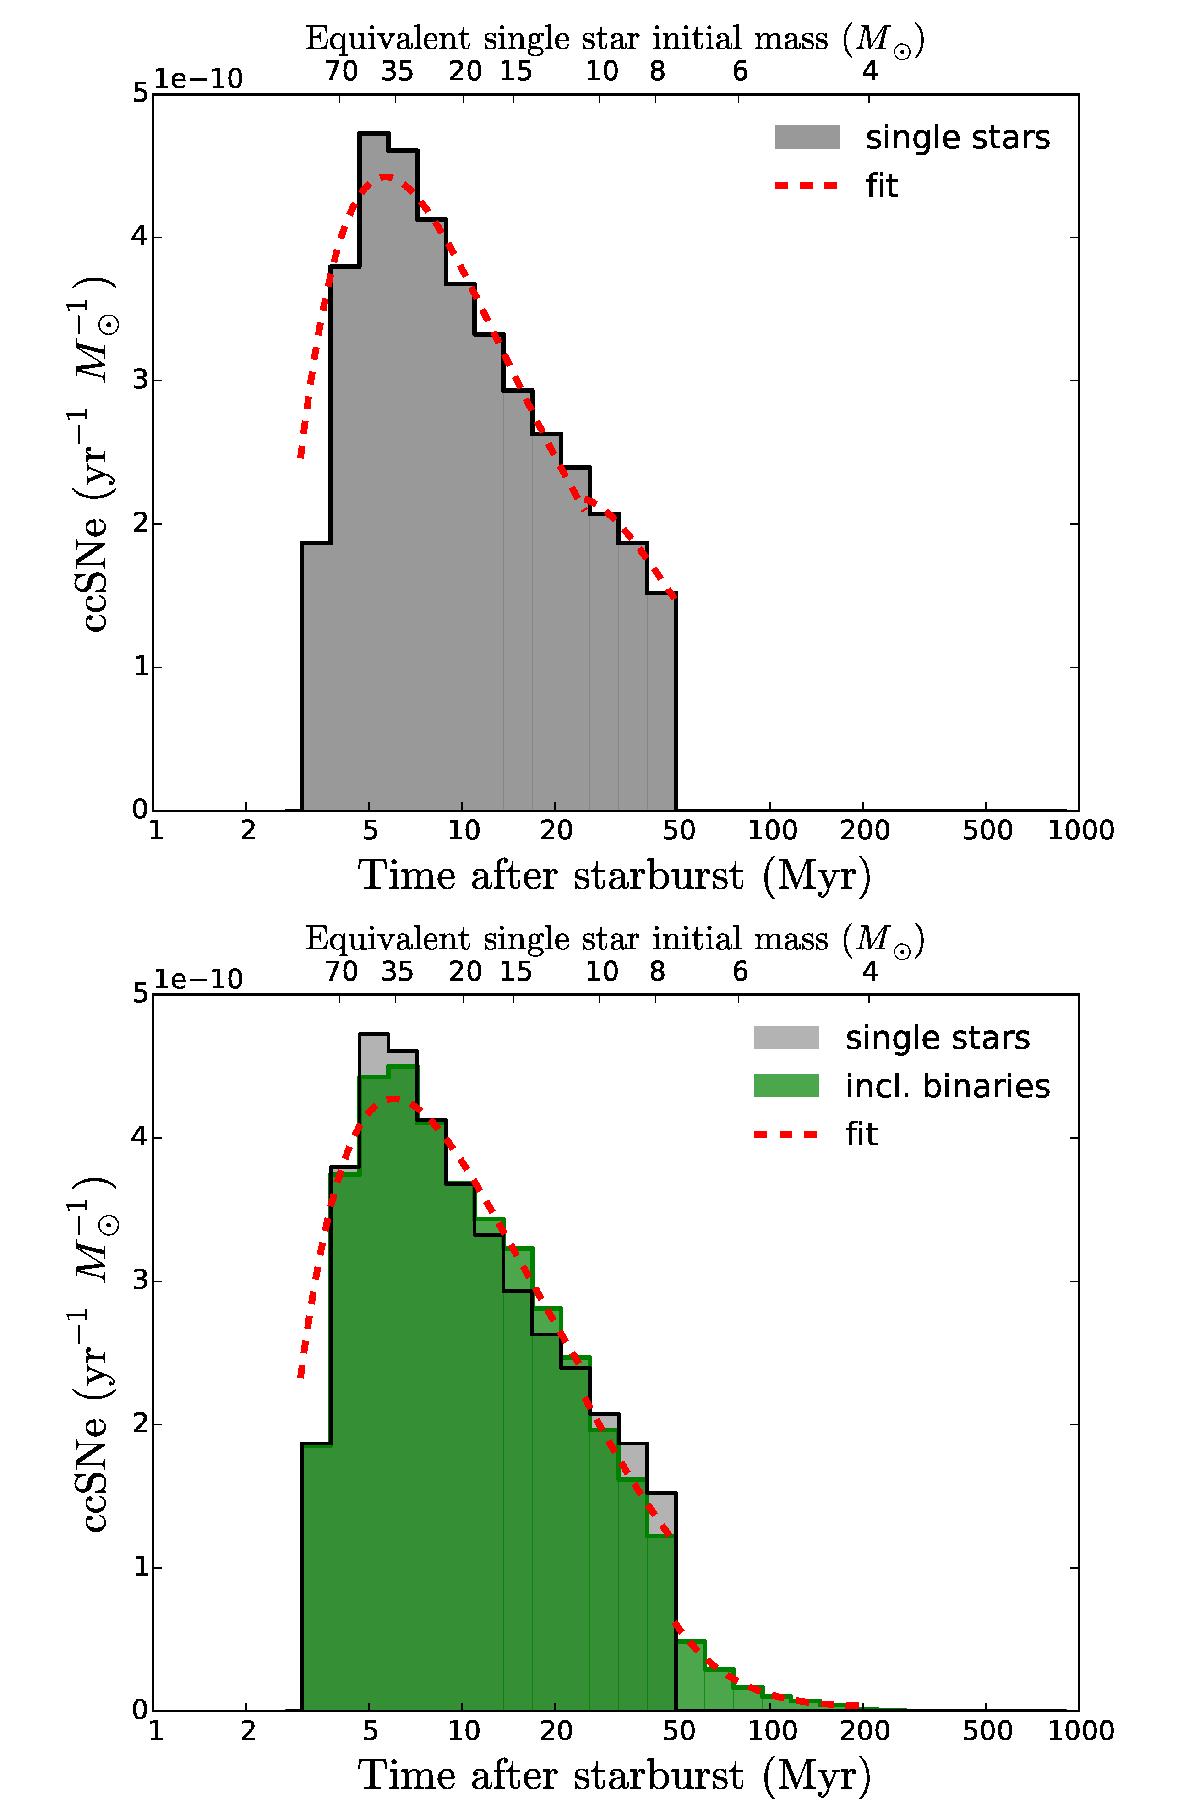
Core-collapse supernova rate as a function of time in a population of single stars (top) and a realistic mix of single stars and binaries (bottom) formed as an instantaneous starburst at t = 0, for our standard assumptions. The red dashed lines show the fitting formulae. The top axis shows the initial mass of single stars with the corresponding lifetime given in the bottom axis, computed with binary_c.
Current usage metrics show cumulative count of Article Views (full-text article views including HTML views, PDF and ePub downloads, according to the available data) and Abstracts Views on Vision4Press platform.
Data correspond to usage on the plateform after 2015. The current usage metrics is available 48-96 hours after online publication and is updated daily on week days.
Initial download of the metrics may take a while.