Fig. 6
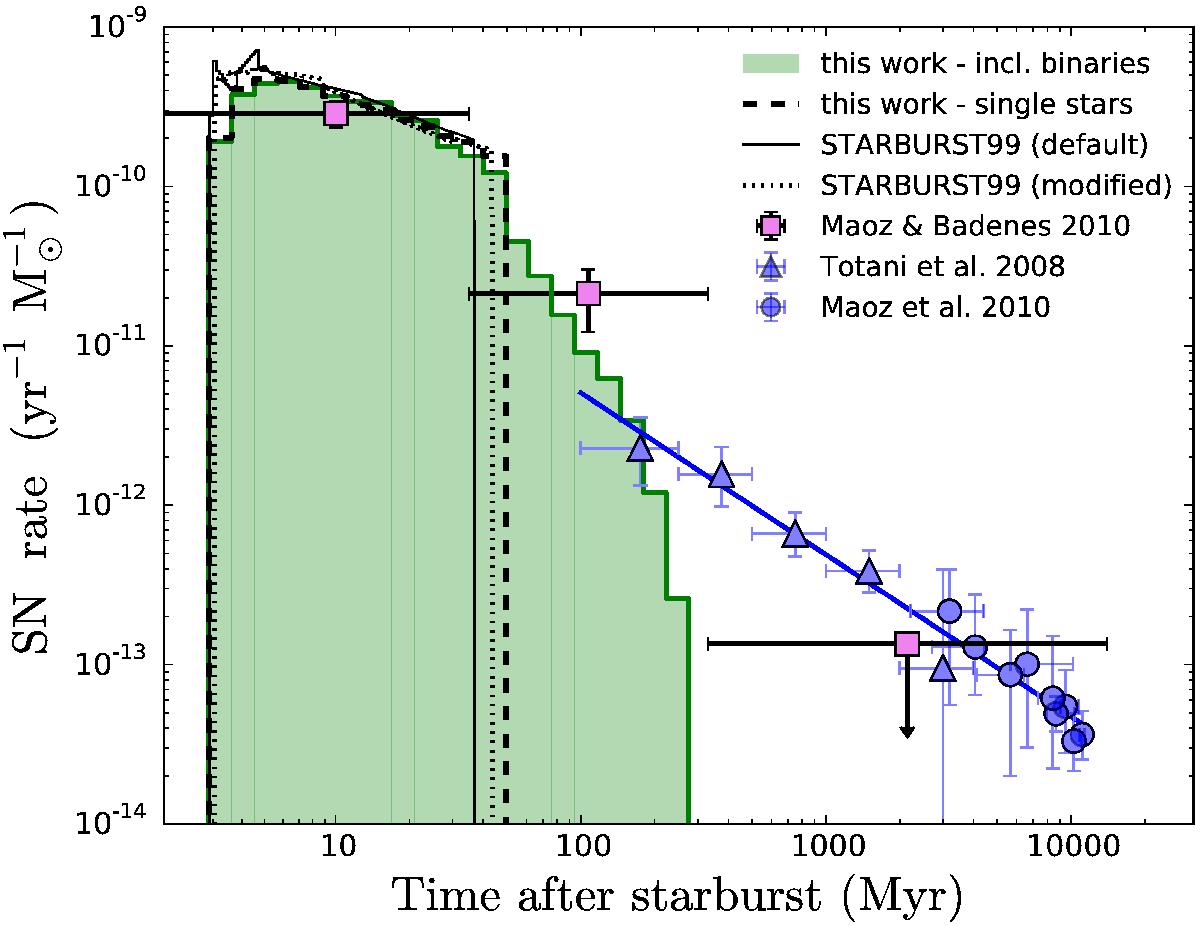
Comparison of our delay-time distribution of ccSNe including binaries (green shading) with those of our single-star population (black dashed line) and predictions by STARBURST99 (thin full and dotted lines, see Sect. 4.3 for a description). We further show measurements by Maoz & Badenes (2010) using Magellanic Cloud supernova remnants (pink squares), which contain a combination of remnants of ccSNe and SNe Ia. Blue triangles and circles represent the observed rates of SNe Ia measured in extragalactic surveys in Totani et al. (2008) and Maoz et al. (2010), respectively. The blue line is a t-1 fit through the extragalactic data. Horizontal error bars indicate the bin size. Vertical errorbars show the 1σ error bars on the rate. The rightmost pink supernova rate is an upper limit. We argue that “late” ccSNe can help explain the discrepancy between the intermediate age bin in the DTD by Maoz & Badenes (2010, central pink square) and the trend in the extragalactic SNe Ia (blue line), instead of the original interpretation that this age bin includes only “prompt” SNe Ia (see discussion in Sect. 5.2).
Current usage metrics show cumulative count of Article Views (full-text article views including HTML views, PDF and ePub downloads, according to the available data) and Abstracts Views on Vision4Press platform.
Data correspond to usage on the plateform after 2015. The current usage metrics is available 48-96 hours after online publication and is updated daily on week days.
Initial download of the metrics may take a while.