Fig. 3
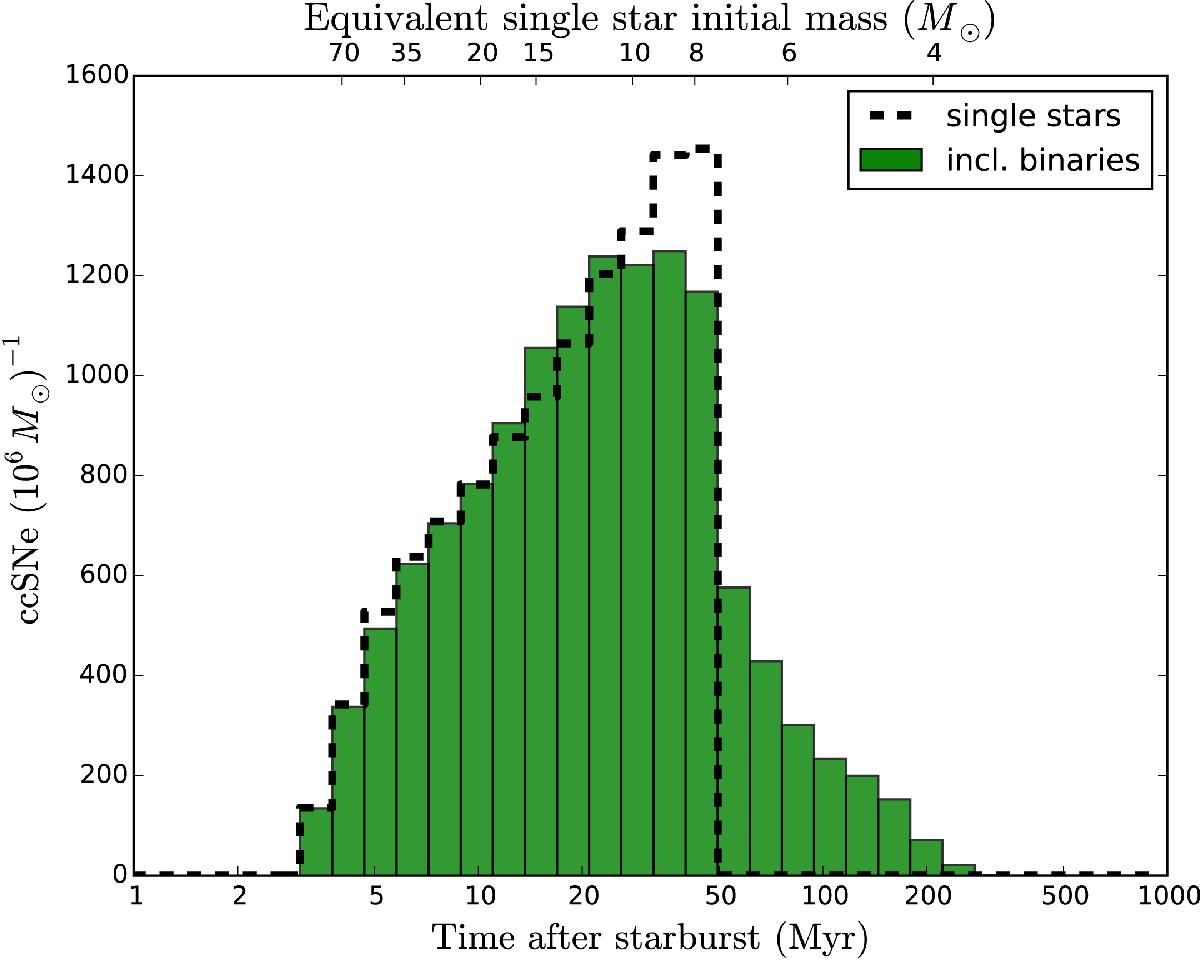
Delay-time distribution of core-collapse supernovae for a population consisting of 70% binary systems (green histogram) compared to the distribution for a population of only single stars (black dashed line). It shows the number of events per logarithmic time bin for a starburst of 106M⊙ for our standard models. The top axis shows the initial mass of single stars with the corresponding lifetime given in the bottom axis, computed with binary_c. The most striking difference is the fraction of “late” core-collapse supernovae (![]() ), after the last massive single star explodes at τmax,cc ≈ 48Myr. The errors in the fraction above result from variations of our standard assumptions.
), after the last massive single star explodes at τmax,cc ≈ 48Myr. The errors in the fraction above result from variations of our standard assumptions.
Current usage metrics show cumulative count of Article Views (full-text article views including HTML views, PDF and ePub downloads, according to the available data) and Abstracts Views on Vision4Press platform.
Data correspond to usage on the plateform after 2015. The current usage metrics is available 48-96 hours after online publication and is updated daily on week days.
Initial download of the metrics may take a while.