Fig. 2
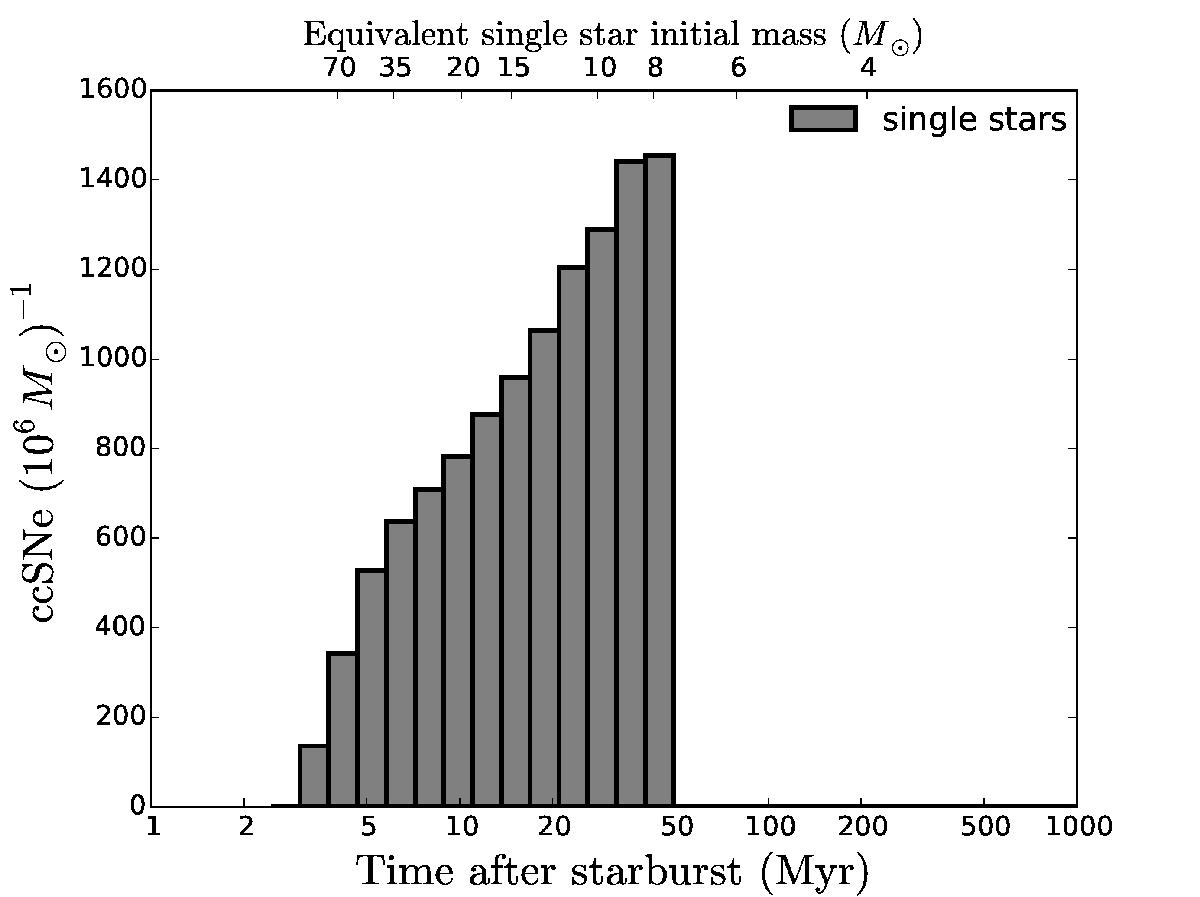
Delay-time distribution of core-collapse supernovae based on our single star models. The diagram shows the number of events per logarithmic time bin for a starburst of 106M⊙ in our standard model. The top axis shows the initial mass of single stars with the corresponding lifetime given in the bottom axis, computed with binary_c. The most massive stars evolve most rapidly and end their life after approximately 3Myr. There are no core-collapse events after approximately 48Myr when the least massive single star that can undergo core collapse explodes.
Current usage metrics show cumulative count of Article Views (full-text article views including HTML views, PDF and ePub downloads, according to the available data) and Abstracts Views on Vision4Press platform.
Data correspond to usage on the plateform after 2015. The current usage metrics is available 48-96 hours after online publication and is updated daily on week days.
Initial download of the metrics may take a while.