Fig. 1
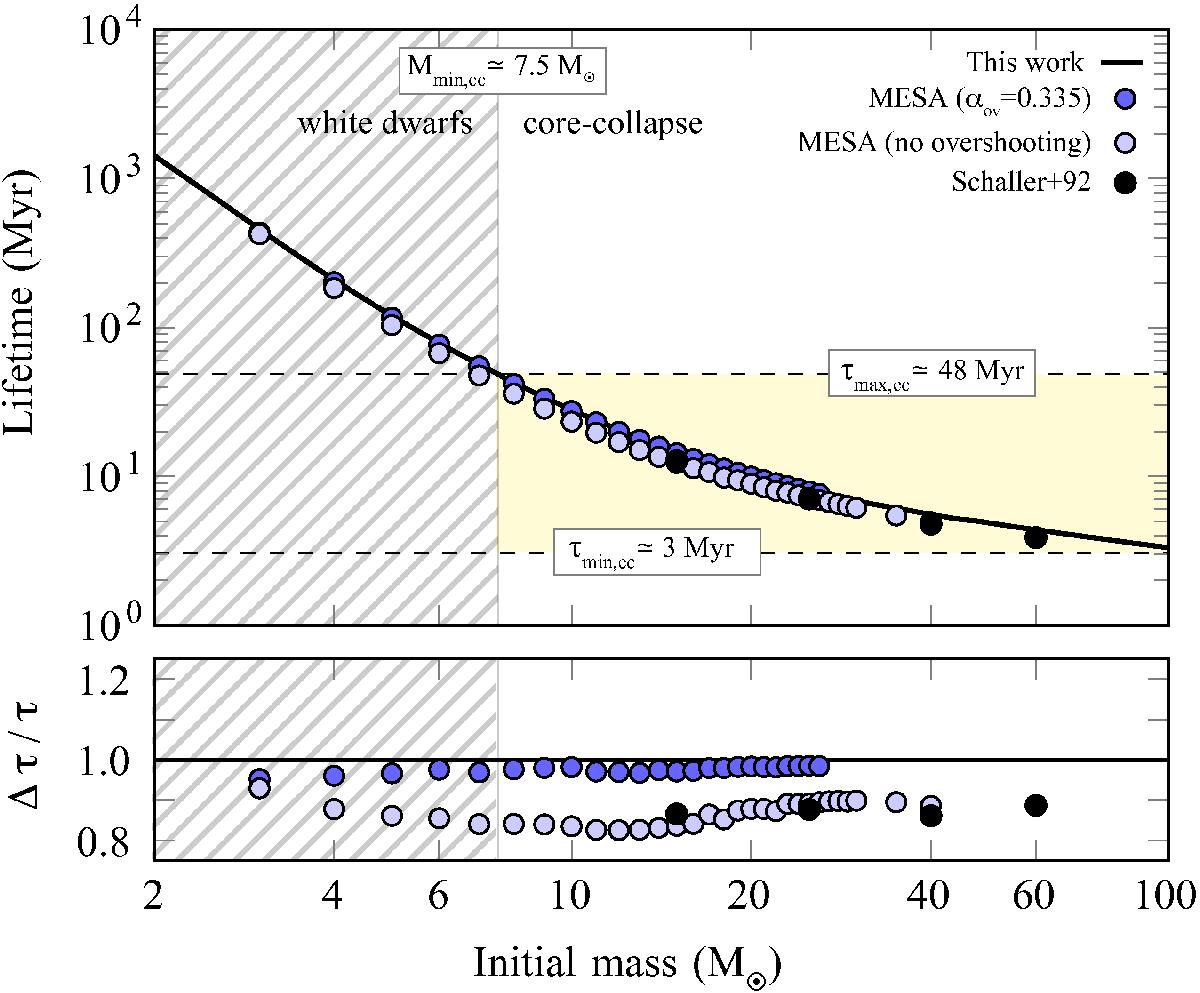
Lifetime τ (until the white dwarf phase or core collapse) as a function of initial mass for single stars adopted in this work (black line) is compared with predictions that we obtained using the MESA stellar evolutionary code (Paxton et al. 2011) with and without overshooting (dark and lightblue dots) and with Geneva models of Schaller et al. (1992, black dots). Single stars with masses less than Mmin,cc end their lives as white dwarfs instead of ccSNe (hashed region). ccSNe are expected between τmin,cc and τmax,cc (yellow shaded region), which refer to the lifetimes of the most and least massive star to undergo core collapse. The bottom panel shows the relative difference in lifetimes with respect to the lifetimes used in our work (Sect. 2.2).
Current usage metrics show cumulative count of Article Views (full-text article views including HTML views, PDF and ePub downloads, according to the available data) and Abstracts Views on Vision4Press platform.
Data correspond to usage on the plateform after 2015. The current usage metrics is available 48-96 hours after online publication and is updated daily on week days.
Initial download of the metrics may take a while.