Fig. 6
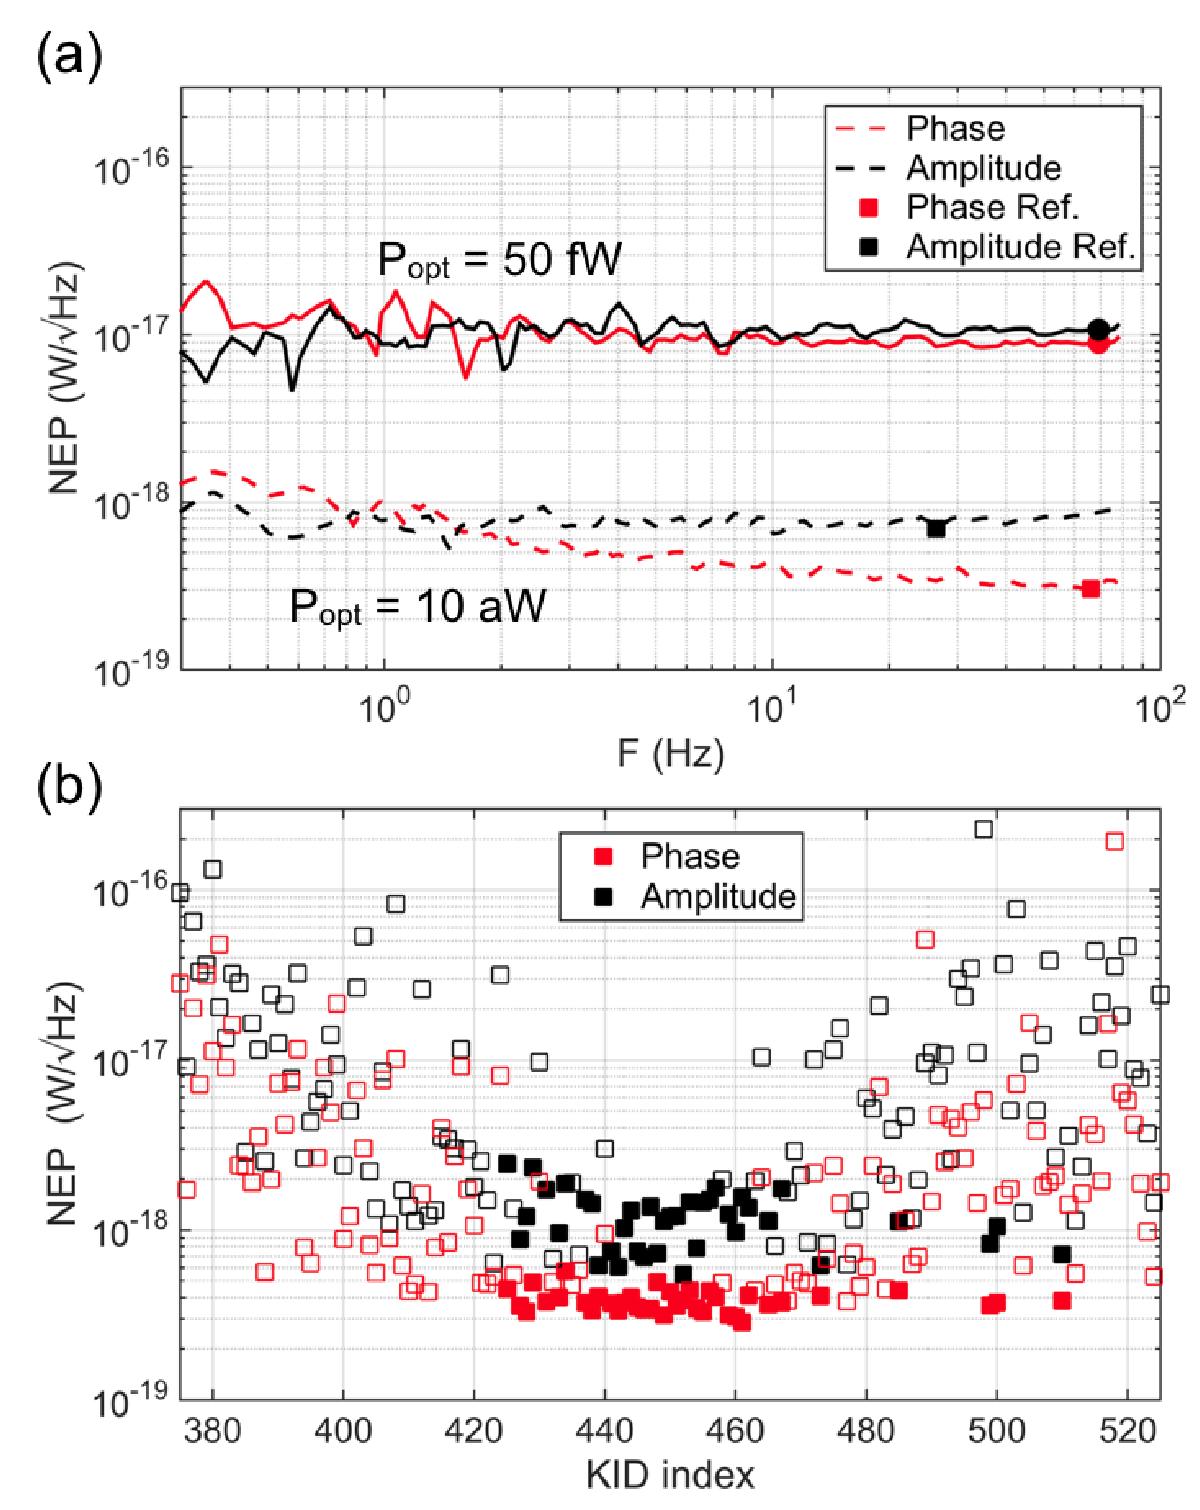
a) Measured detector NEP referred to the power absorbed in the pixel at 10 aW (bottom lines), which represents the performance limit of the detectors, and 50 fW (upper lines). Note the white noise spectra and identical sensitivity using amplitude or phase readout in this case. The dots represent the minimum of the NEP curve shown in panel a) (10 aW case) and the NEP in a 60–80 Hz band for the 50 fW case. b) Minimum NEP, using phase- and amplitude readout at 10 aW loading. The NEP calculation is done using Eq. (4) with the experimentally obtained optical efficiency. The solid symbols represent the detectors that are fully illuminated by the calibration source.
Current usage metrics show cumulative count of Article Views (full-text article views including HTML views, PDF and ePub downloads, according to the available data) and Abstracts Views on Vision4Press platform.
Data correspond to usage on the plateform after 2015. The current usage metrics is available 48-96 hours after online publication and is updated daily on week days.
Initial download of the metrics may take a while.