Fig. 5
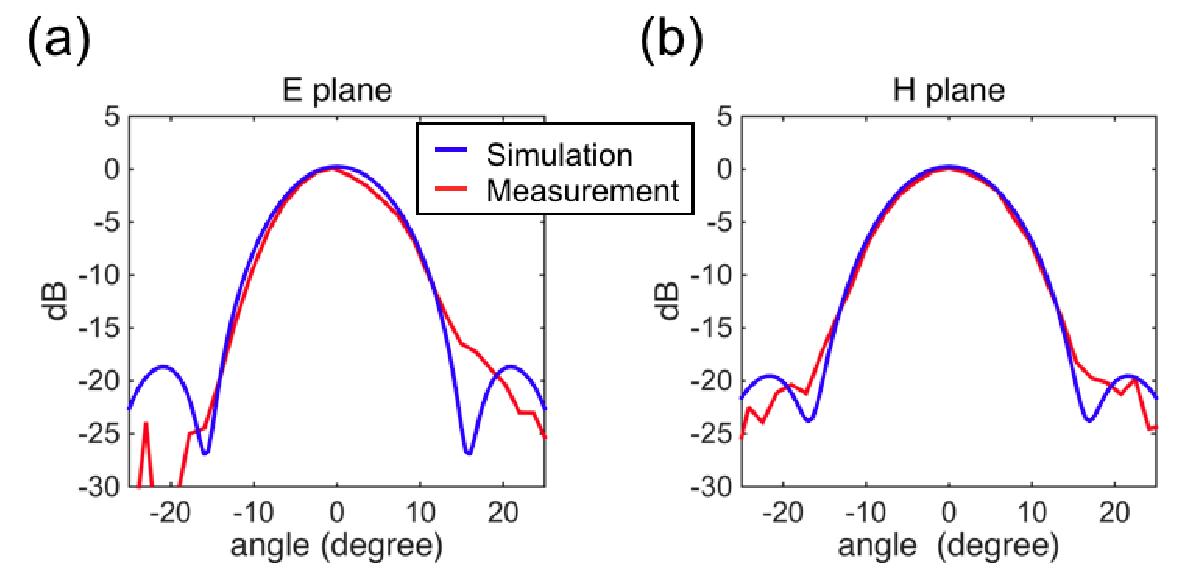
Measured and calculated beam pattern of a single detector on a test chip with identical design, and fabricated on the same wafer, as the array presented here. An excellent agreement for the main beam is observed. Panel a) shows the results in the E plane (cross section perpendicular to the antenna slots) and b) in the H-plane (cross section parallel with the antenna slots).
Current usage metrics show cumulative count of Article Views (full-text article views including HTML views, PDF and ePub downloads, according to the available data) and Abstracts Views on Vision4Press platform.
Data correspond to usage on the plateform after 2015. The current usage metrics is available 48-96 hours after online publication and is updated daily on week days.
Initial download of the metrics may take a while.