Fig. 2
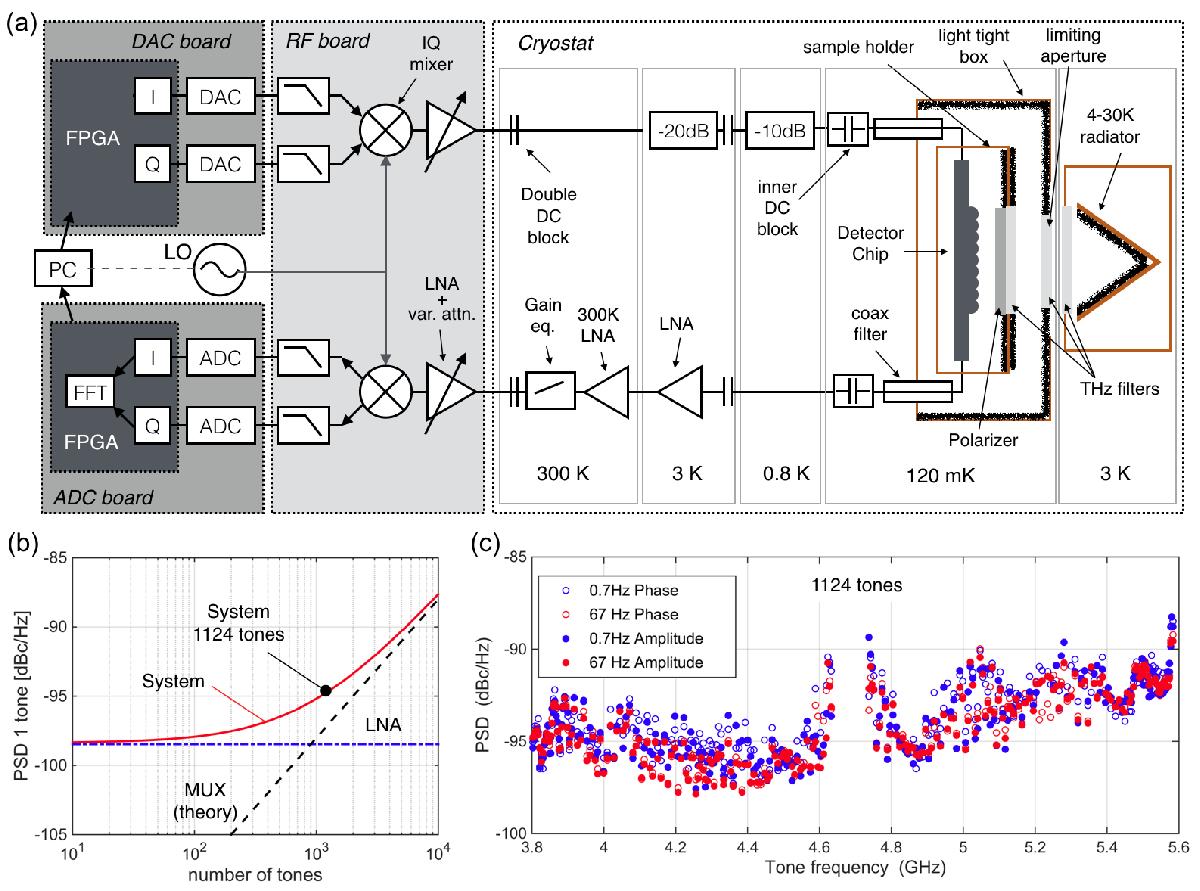
a) Schematic diagram of the experimental system, showing the digital and analogue sections of the readout system, the signal chain for the readout input and output lines and all components used. Note that the chip is mounted inside a light-tight box with coaxial feed-though filters for the readout signals; the thick black structure represents infrared absorber inside the sample holder and light-tight box to minimise stray light. b) Calculated performance of the readout system, expressed in power spectral density of an individual readout tone, as a function of the number of readout tones used. Note the linear decrease in performance with increasing number of tones. c) Measured performance of the readout system with 1124 tones. 874 tones are placed on MKIDs and 250 tones are placed in between MKID resonances. The figure shows the performance of these 250 blind tones. The data are corrected for systematic noise contributions as explained in the text. The open shapes represent the phase noise, and the closed shapes represent the amplitude noise. The colour coding indicated in the legend gives the post-detection frequency at which the noise spectral density is evaluated. The measured performance is very similar in phase and amplitude and also independent of the post-detection frequency down to 0.7 Hz. We do see a small frequency dependence and the deterioration of the readout system near the LO, which is placed at 4.685 GHz.
Current usage metrics show cumulative count of Article Views (full-text article views including HTML views, PDF and ePub downloads, according to the available data) and Abstracts Views on Vision4Press platform.
Data correspond to usage on the plateform after 2015. The current usage metrics is available 48-96 hours after online publication and is updated daily on week days.
Initial download of the metrics may take a while.