Fig. 7
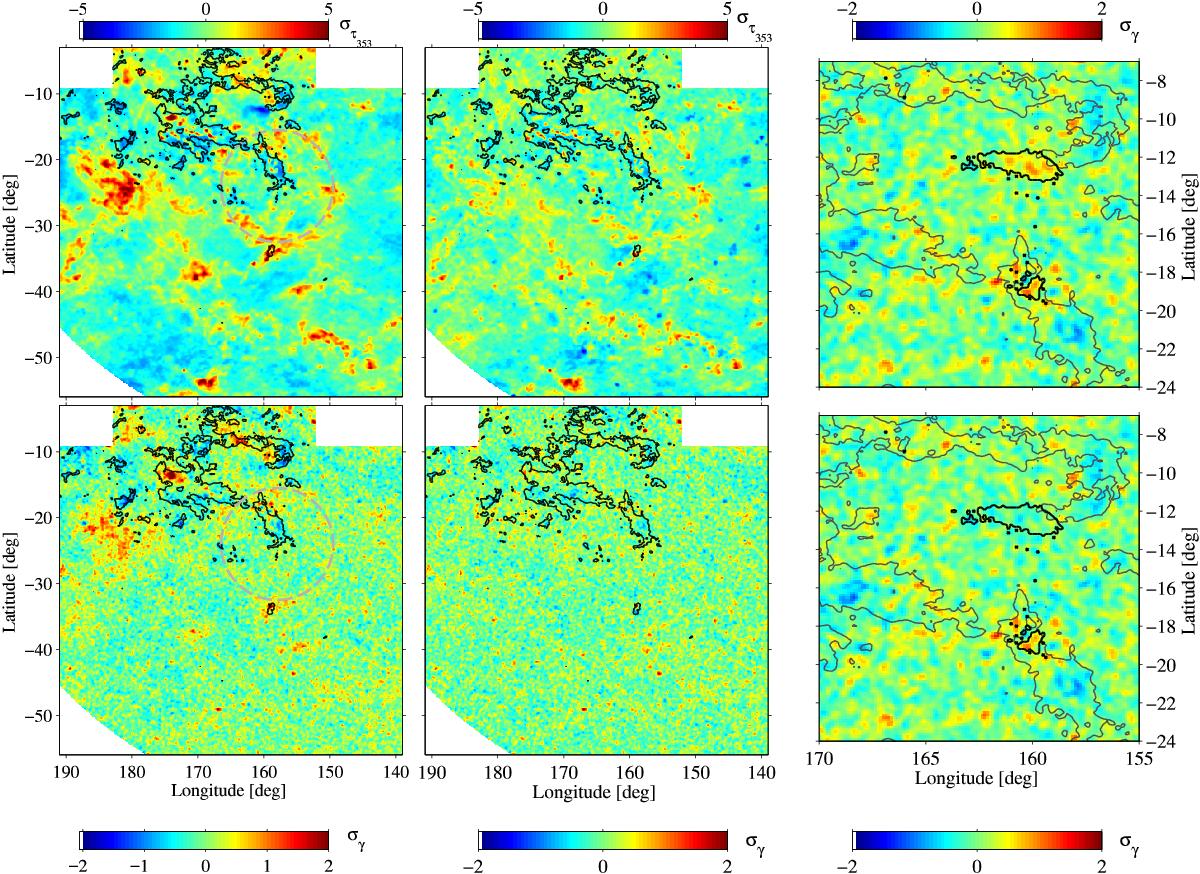
Residual maps (data minus best-fit model, in sigma units) in dust optical depth (στ353) and in γ-ray counts in the 0.4–100 GeV band (σγ) obtained when including different sets of gaseous components in the models: without (left) and with (middle) the DNM and COsat components in addition to the H i, CO, and free-free templates; a close-up view (right) of the γ-ray residuals without (top) and with (bottom) the free-free map. The grey circles in the left-hand column highlight a DNM shell. The thin black contours outline the shape of the CO clouds at the 7 K km s-1 level chosen to separate DNM and COsat components. The thick black contours in the right-hand column outline the shape of the NGC 1499 and G159.6-18.5 H iiregions at the 2 × 10⁴ Jy sr-1 level in free-free emission at 70 GHz. The models are derived for an H ispin temperature of 400 K.
Current usage metrics show cumulative count of Article Views (full-text article views including HTML views, PDF and ePub downloads, according to the available data) and Abstracts Views on Vision4Press platform.
Data correspond to usage on the plateform after 2015. The current usage metrics is available 48-96 hours after online publication and is updated daily on week days.
Initial download of the metrics may take a while.