Fig. 15
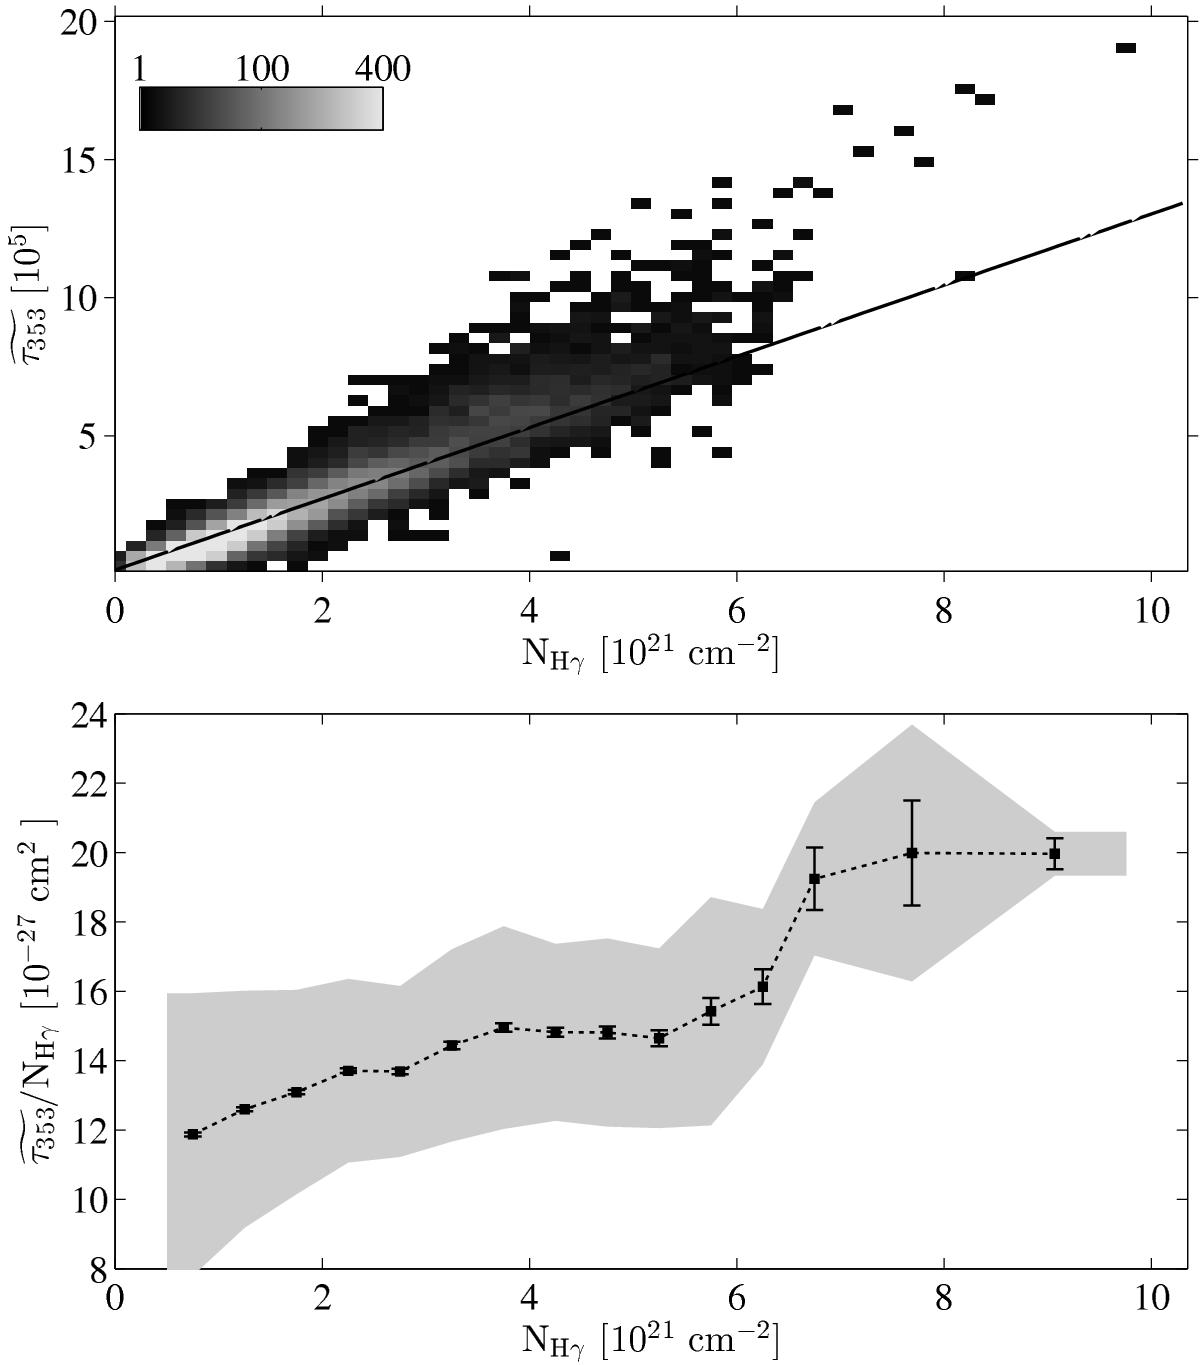
Upper: 2D histogram of the correlation between the total gas column density, NH γ, measured with the 0.4–100 GeV interstellar γ rays, and the dust optical depth at 353 GHz, convolved with the LAT response for an interstellar spectrum. The maps were sampled at a 0.̊375 resolution. Lower: evolution of the dust opacity in NH bins. The error bars give the standard errors of the means and the grey band gives the standard deviation of the opacities in each bin.
Current usage metrics show cumulative count of Article Views (full-text article views including HTML views, PDF and ePub downloads, according to the available data) and Abstracts Views on Vision4Press platform.
Data correspond to usage on the plateform after 2015. The current usage metrics is available 48-96 hours after online publication and is updated daily on week days.
Initial download of the metrics may take a while.