Free Access
Fig. 11
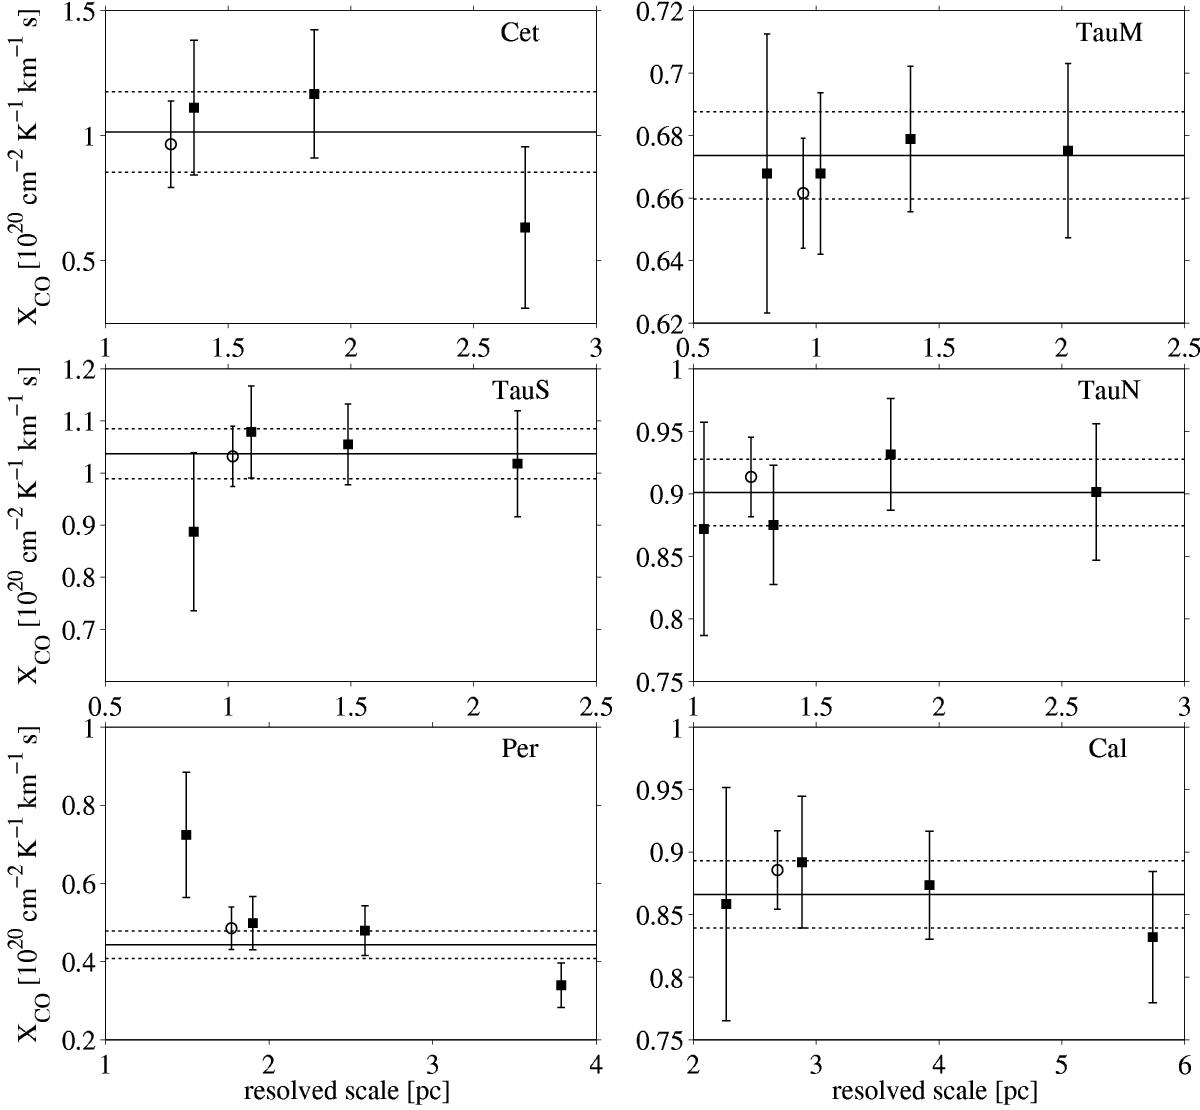
Evolution of the XCO factor, as measured in γ rays for various linear resolutions in the different clouds. The open circle marks the value obtained in the overall 0.4–100 GeV band, in close agreement with the weighted average of the four independent energy bands (black line) and its 1σ errors (dashed lines).
Current usage metrics show cumulative count of Article Views (full-text article views including HTML views, PDF and ePub downloads, according to the available data) and Abstracts Views on Vision4Press platform.
Data correspond to usage on the plateform after 2015. The current usage metrics is available 48-96 hours after online publication and is updated daily on week days.
Initial download of the metrics may take a while.