Free Access
Fig. 4
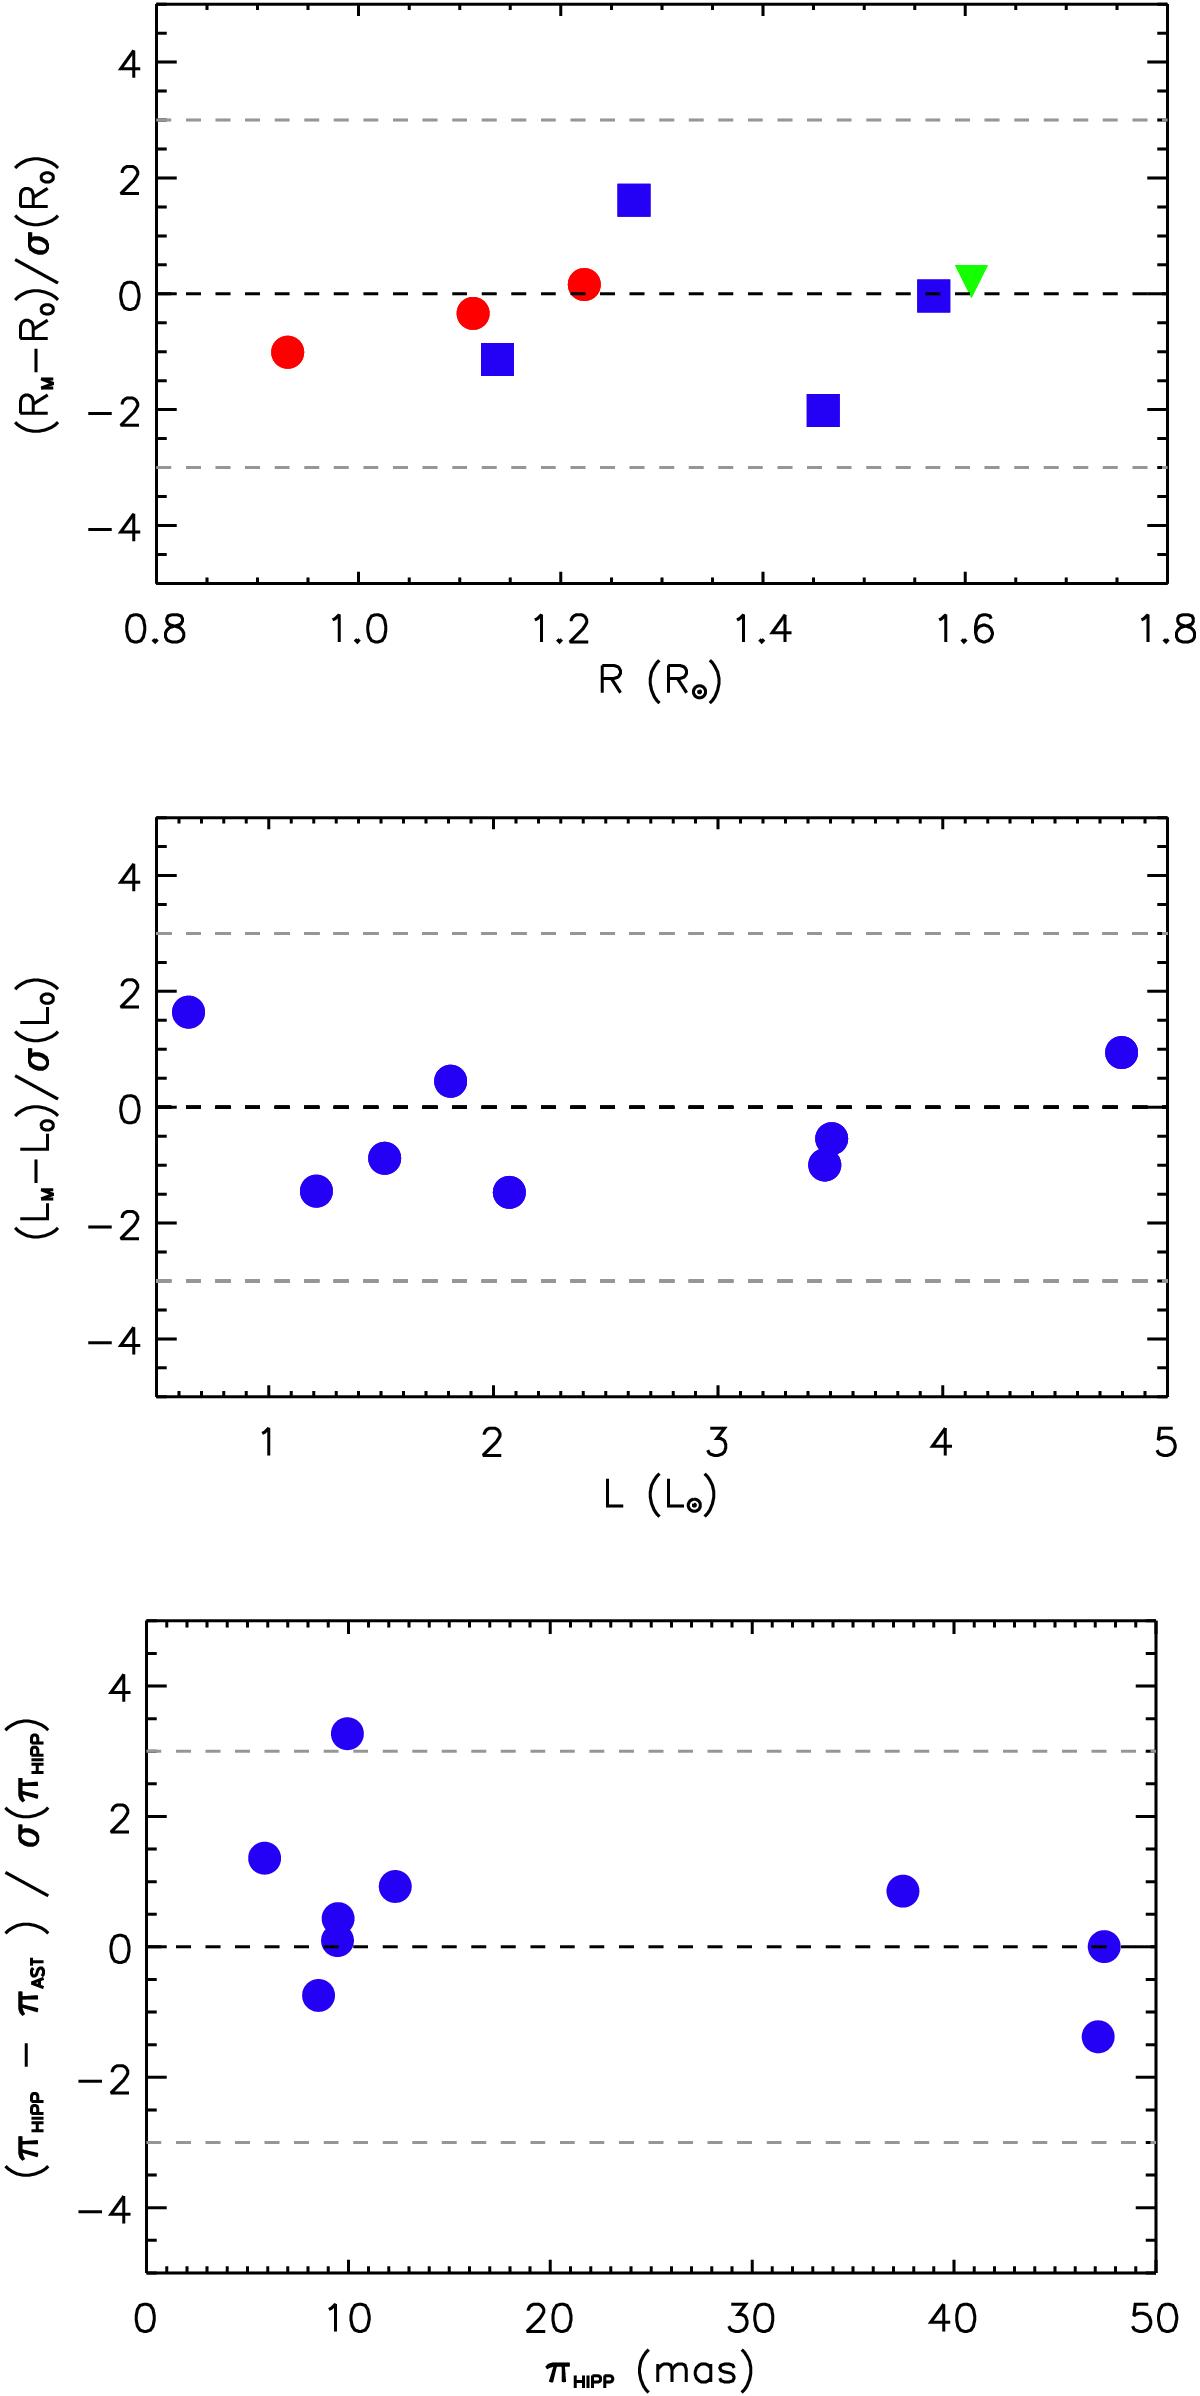
Comparison of measured radii (top), luminosities (middle), and parallaxes (lower) with those deduced from the asteroseismic parameters. The interferometric radii are denoted by the red circles in the top panel, and the green triangle is the value from Masana et al. (2006).
This figure is made of several images, please see below:
Current usage metrics show cumulative count of Article Views (full-text article views including HTML views, PDF and ePub downloads, according to the available data) and Abstracts Views on Vision4Press platform.
Data correspond to usage on the plateform after 2015. The current usage metrics is available 48-96 hours after online publication and is updated daily on week days.
Initial download of the metrics may take a while.