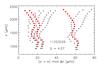
Fig. A.1
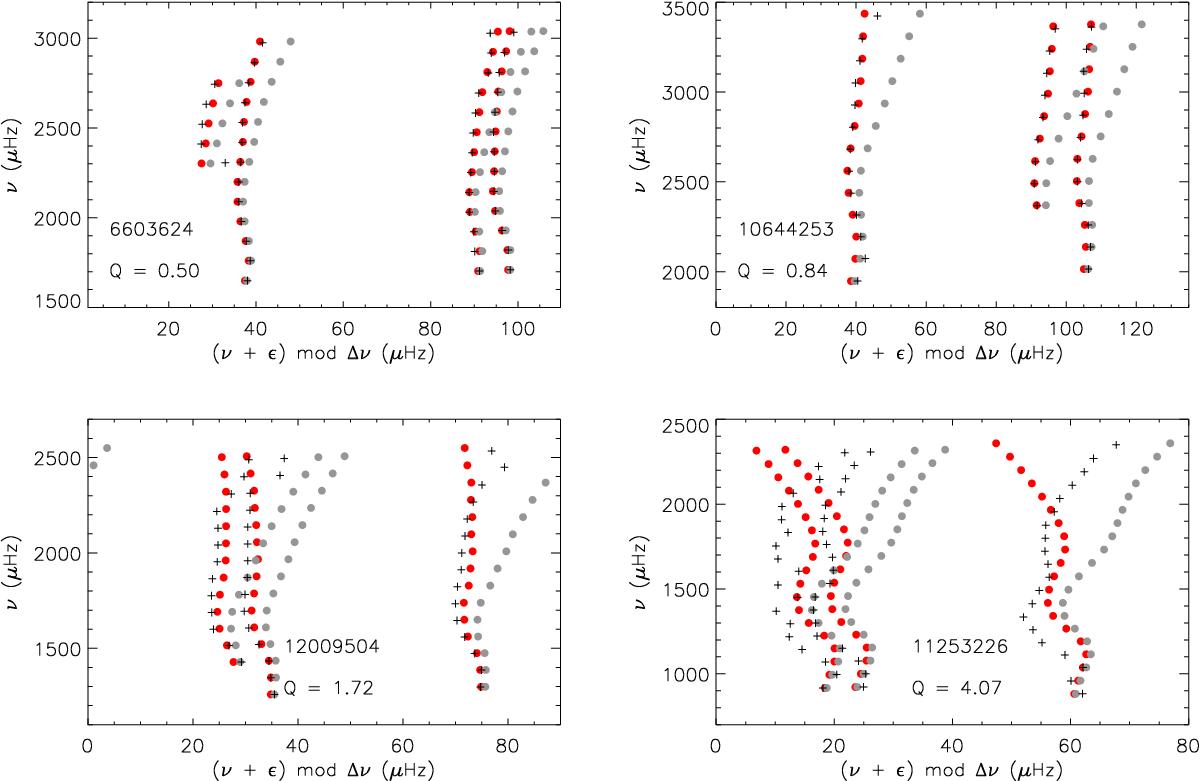
Echelle diagrams for two stars where the surface correction appears to be useful (top) and for two stars where the correction is not useful (lower). Crosses are observed frequencies, gray circles are model frequencies, and red circles are corrected frequencies. The value of ϵ is an arbitrary shift in x-axis for display purposes.
Current usage metrics show cumulative count of Article Views (full-text article views including HTML views, PDF and ePub downloads, according to the available data) and Abstracts Views on Vision4Press platform.
Data correspond to usage on the plateform after 2015. The current usage metrics is available 48-96 hours after online publication and is updated daily on week days.
Initial download of the metrics may take a while.