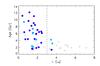
Fig. 10
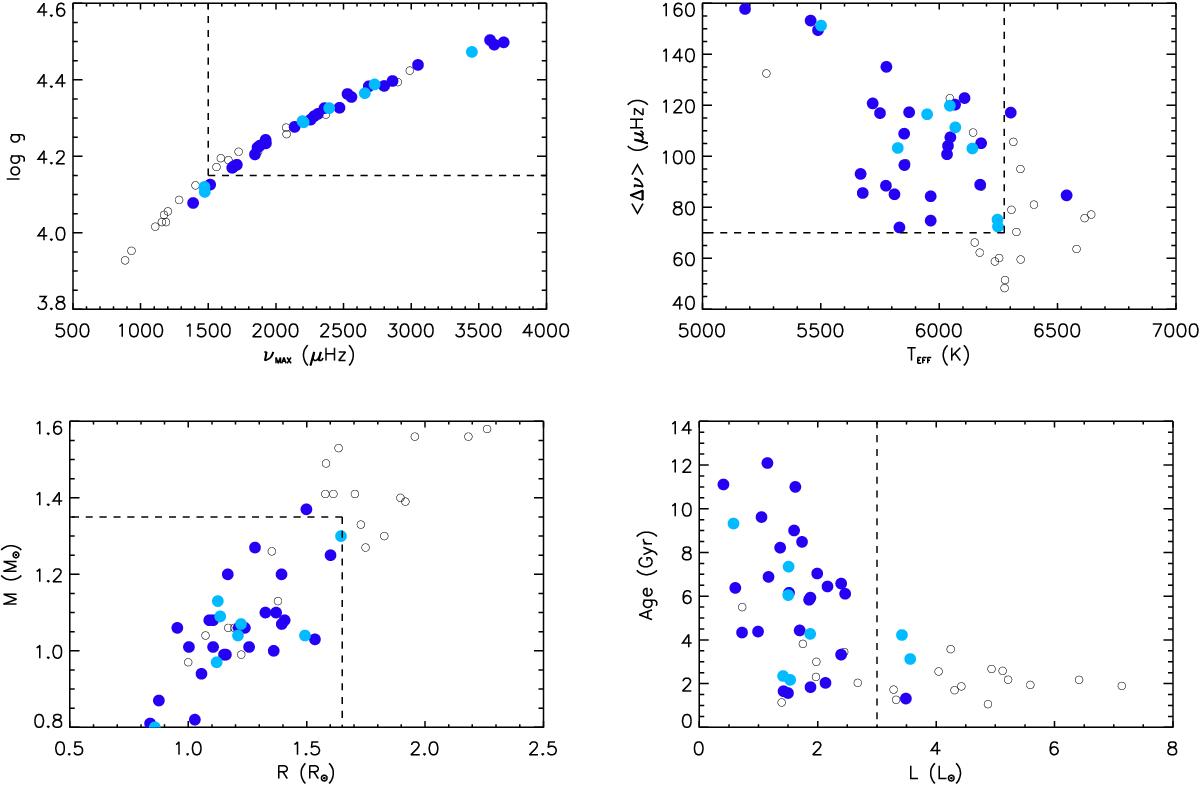
Distribution of observed (top panels) and derived parameters (lower panels) for the selected subsample of stars (open circles). The dark and light blue filled dots represent the stars with Q ≤ 1.0 and 1.2. The regions are delimited by dashed lines within which we infer that the Kjeldsen et al. (2008) surface prescription should be useful.
Current usage metrics show cumulative count of Article Views (full-text article views including HTML views, PDF and ePub downloads, according to the available data) and Abstracts Views on Vision4Press platform.
Data correspond to usage on the plateform after 2015. The current usage metrics is available 48-96 hours after online publication and is updated daily on week days.
Initial download of the metrics may take a while.