Free Access
Fig. 9
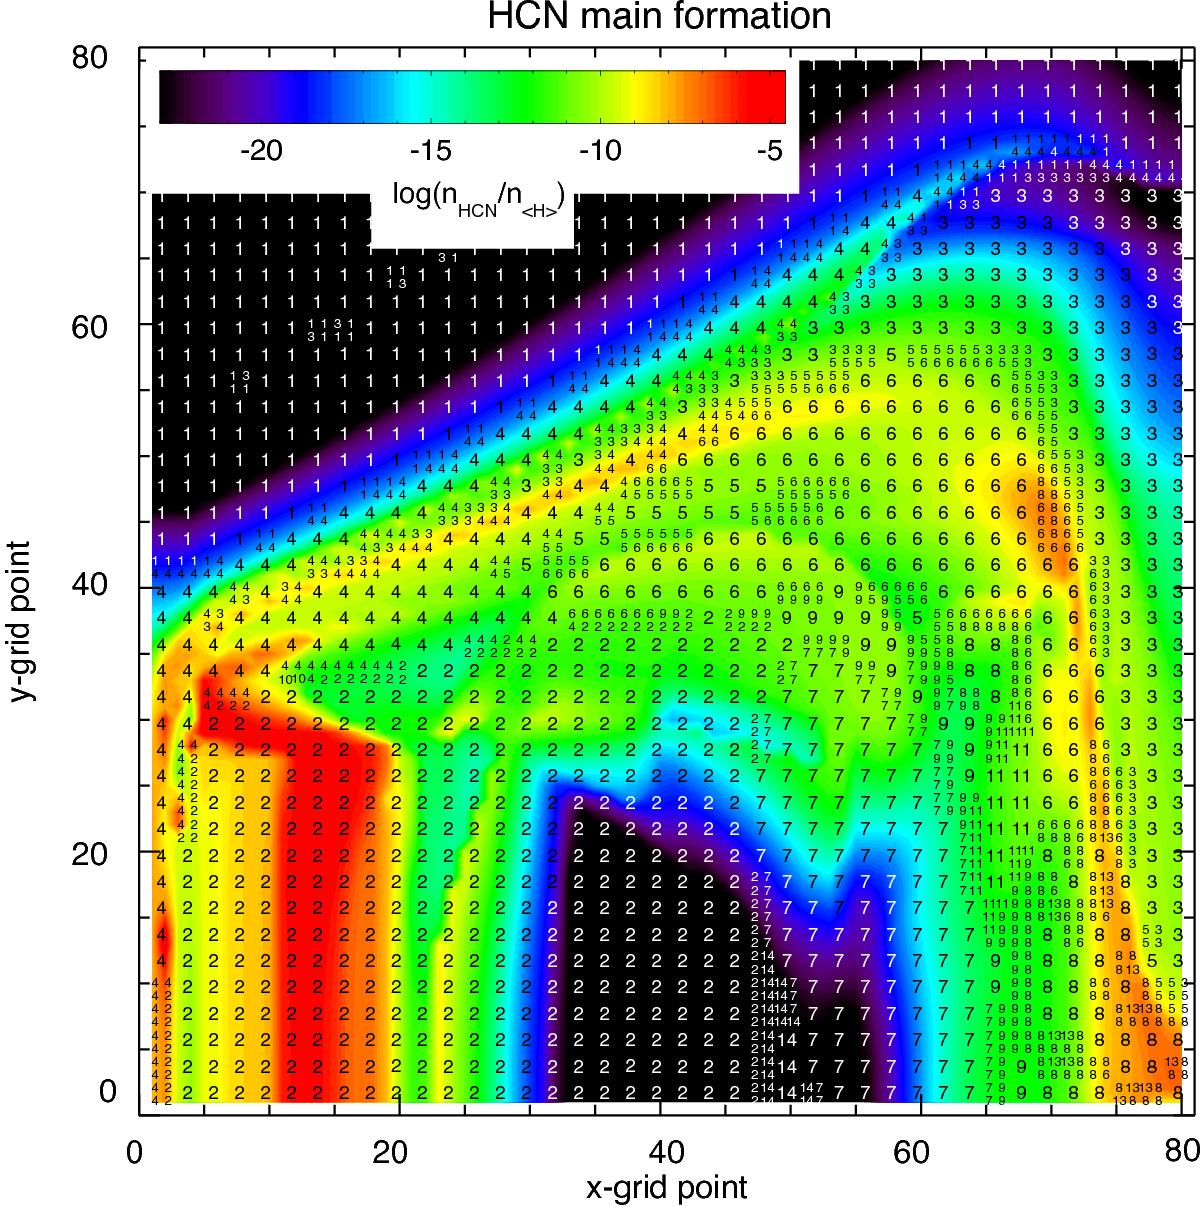
Colour map of the HCN abundance of the fiducial model, overplotted with numbers that show the dominant formation reaction at each grid point. These reactions are enumerated in Table 3. For legibility, the grid points have been binned where the same reaction number is dominant in a square of four cells.
Current usage metrics show cumulative count of Article Views (full-text article views including HTML views, PDF and ePub downloads, according to the available data) and Abstracts Views on Vision4Press platform.
Data correspond to usage on the plateform after 2015. The current usage metrics is available 48-96 hours after online publication and is updated daily on week days.
Initial download of the metrics may take a while.