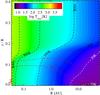
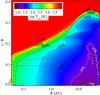
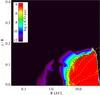
Fig. 4

Left: dust temperature structure of the fiducial model. Overlaid on this plot (and the middle plot) are contours for the plotted temperatures, and extinction contours for vertical AV = 1 and AV = 10. Middle: gas temperature structure of the fiducial model. Right: CO ice line. We follow the ice line definition of Antonellini (2016), with the ice line being defined as where the gas and ice abundances are equal. Dust temperature contours are marked at 15, 20, and 25 K.
Current usage metrics show cumulative count of Article Views (full-text article views including HTML views, PDF and ePub downloads, according to the available data) and Abstracts Views on Vision4Press platform.
Data correspond to usage on the plateform after 2015. The current usage metrics is available 48-96 hours after online publication and is updated daily on week days.
Initial download of the metrics may take a while.