Fig. 6
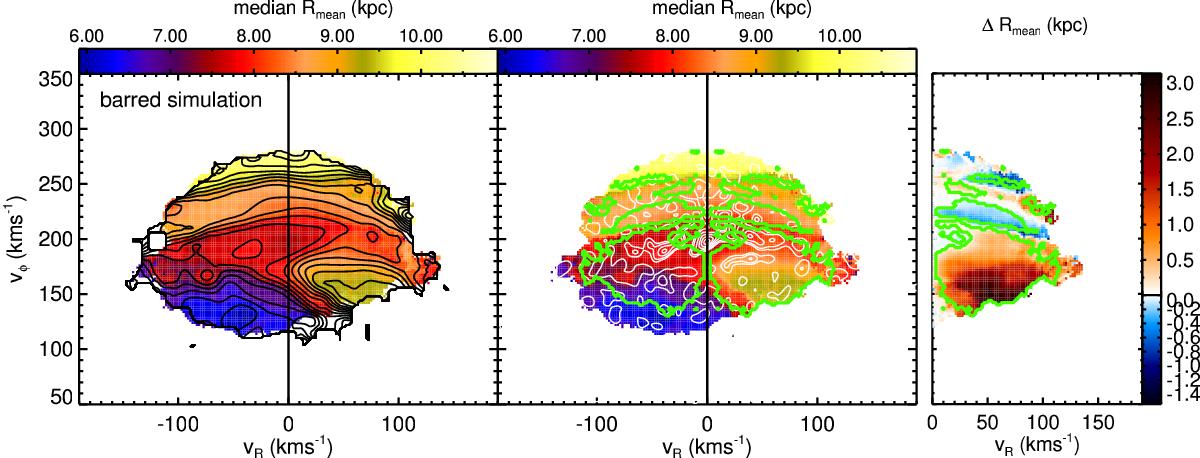
Median orbital radius of the bins in the velocity plane of simulations in a Galactic potential with a bar. Left panel: contours every 0.25 kpc in the range of [6,10.5] kpc. Middle panel: same as the left one but shows the contours of the wavelet transform (white contours), which indicate the main over-densities in the velocity plane, and the green contours that mark the regions where the median orbital radius is significantly different with a 95% confidence from its symmetric vR region. Right panel: differences in the median orbital radius (depicted in the left and middle panels) for particles with positive and negative vR. The green contours are the same as for the middle panel.
Current usage metrics show cumulative count of Article Views (full-text article views including HTML views, PDF and ePub downloads, according to the available data) and Abstracts Views on Vision4Press platform.
Data correspond to usage on the plateform after 2015. The current usage metrics is available 48-96 hours after online publication and is updated daily on week days.
Initial download of the metrics may take a while.