Free Access
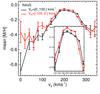
Fig. 4
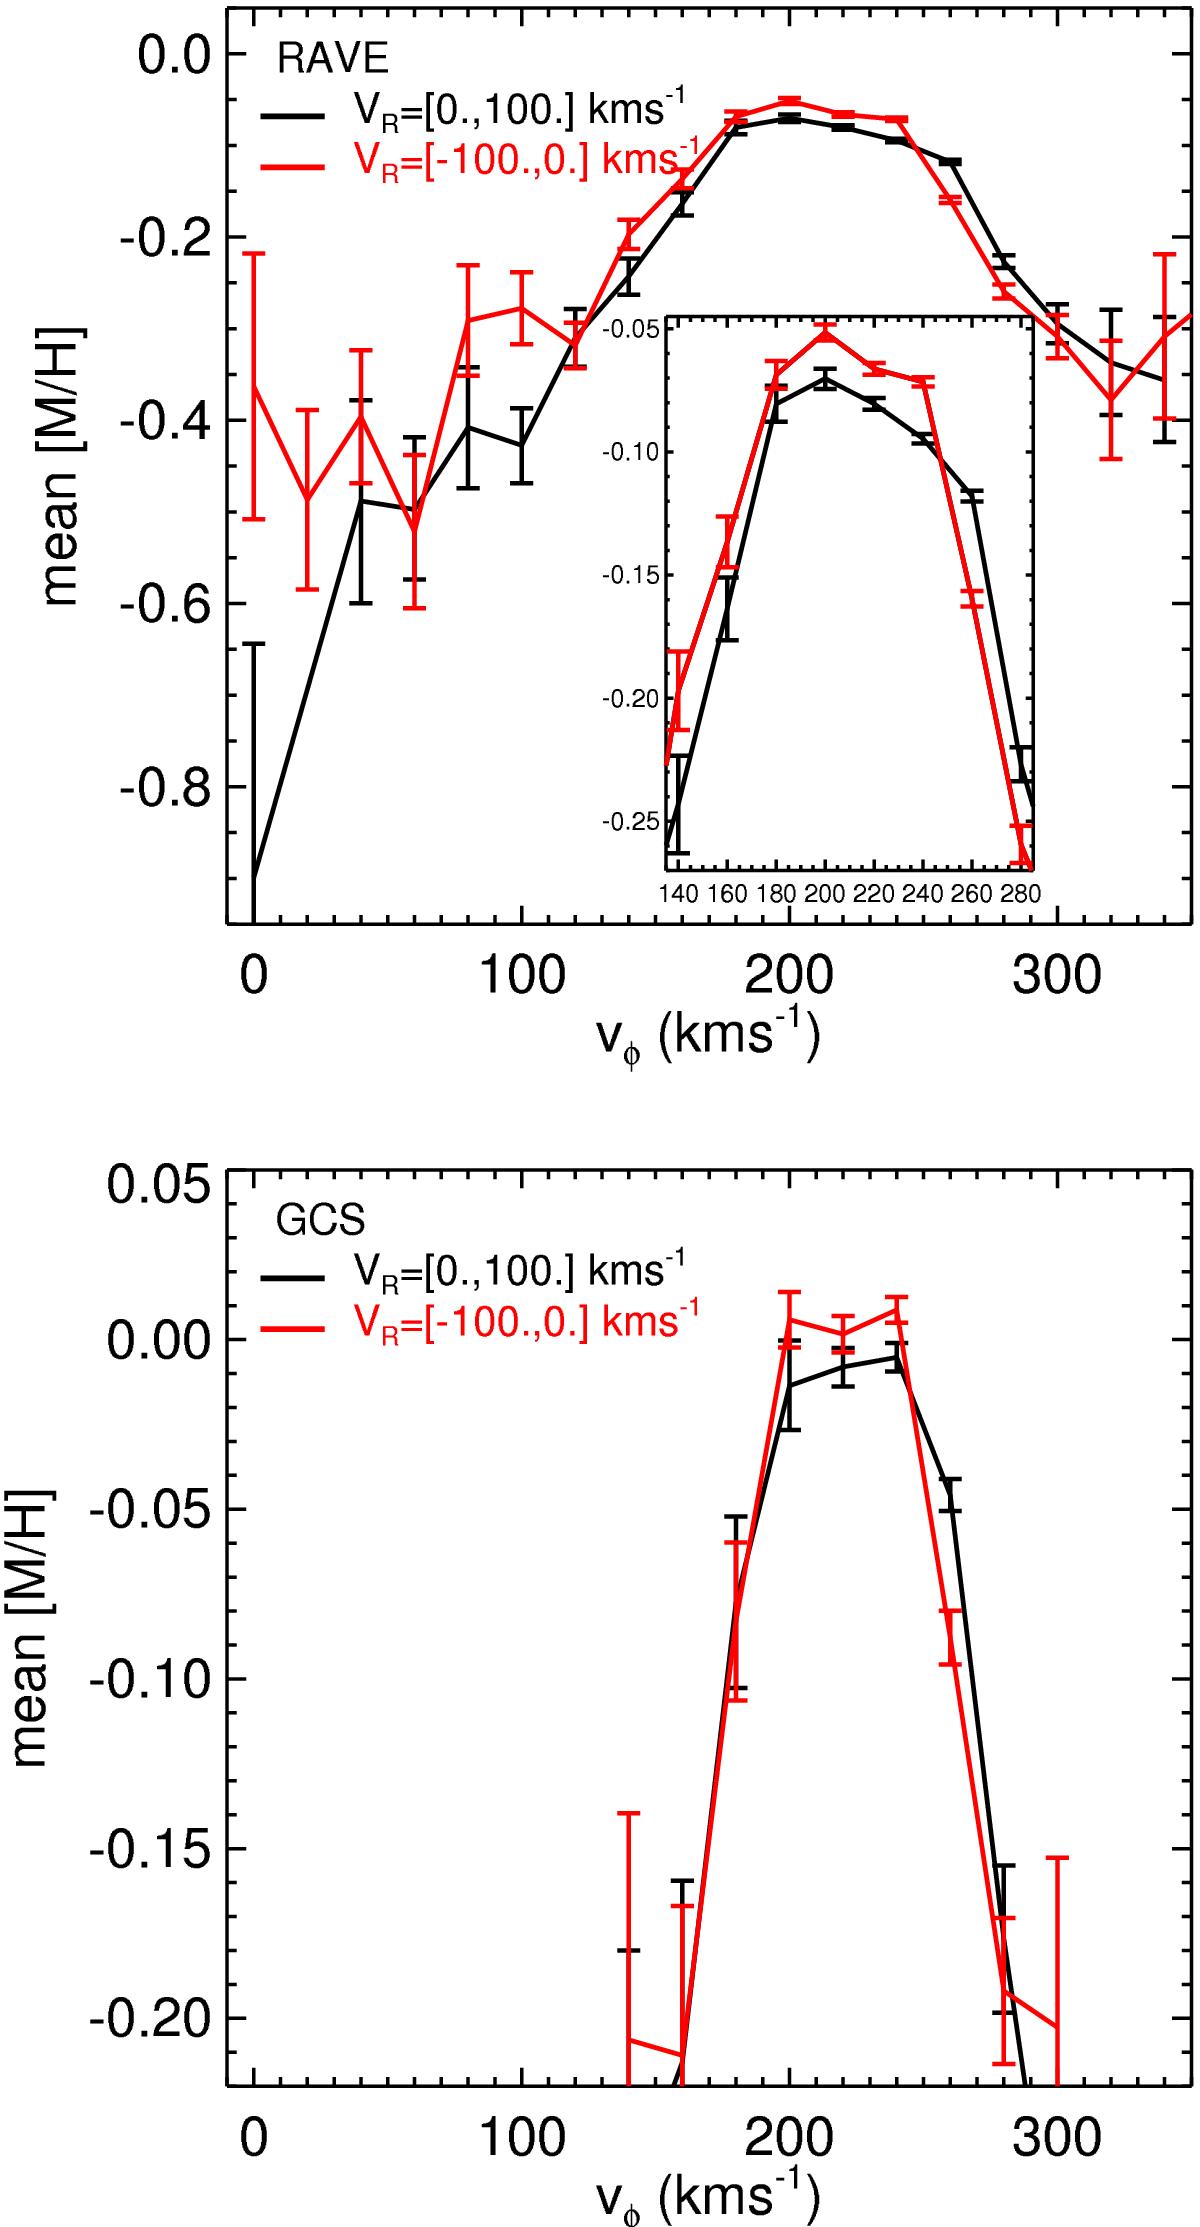
Top: mean metallicity as a function of vφ for the positive and negative vR (black and red lines, respectively) for the RAVE sample. The error bars show the 75% confidence band. The box in the top panel shows a zoom around vφ = 200 km s-1. Bottom: same for the GCS sample.
This figure is made of several images, please see below:
Current usage metrics show cumulative count of Article Views (full-text article views including HTML views, PDF and ePub downloads, according to the available data) and Abstracts Views on Vision4Press platform.
Data correspond to usage on the plateform after 2015. The current usage metrics is available 48-96 hours after online publication and is updated daily on week days.
Initial download of the metrics may take a while.