Fig. 2
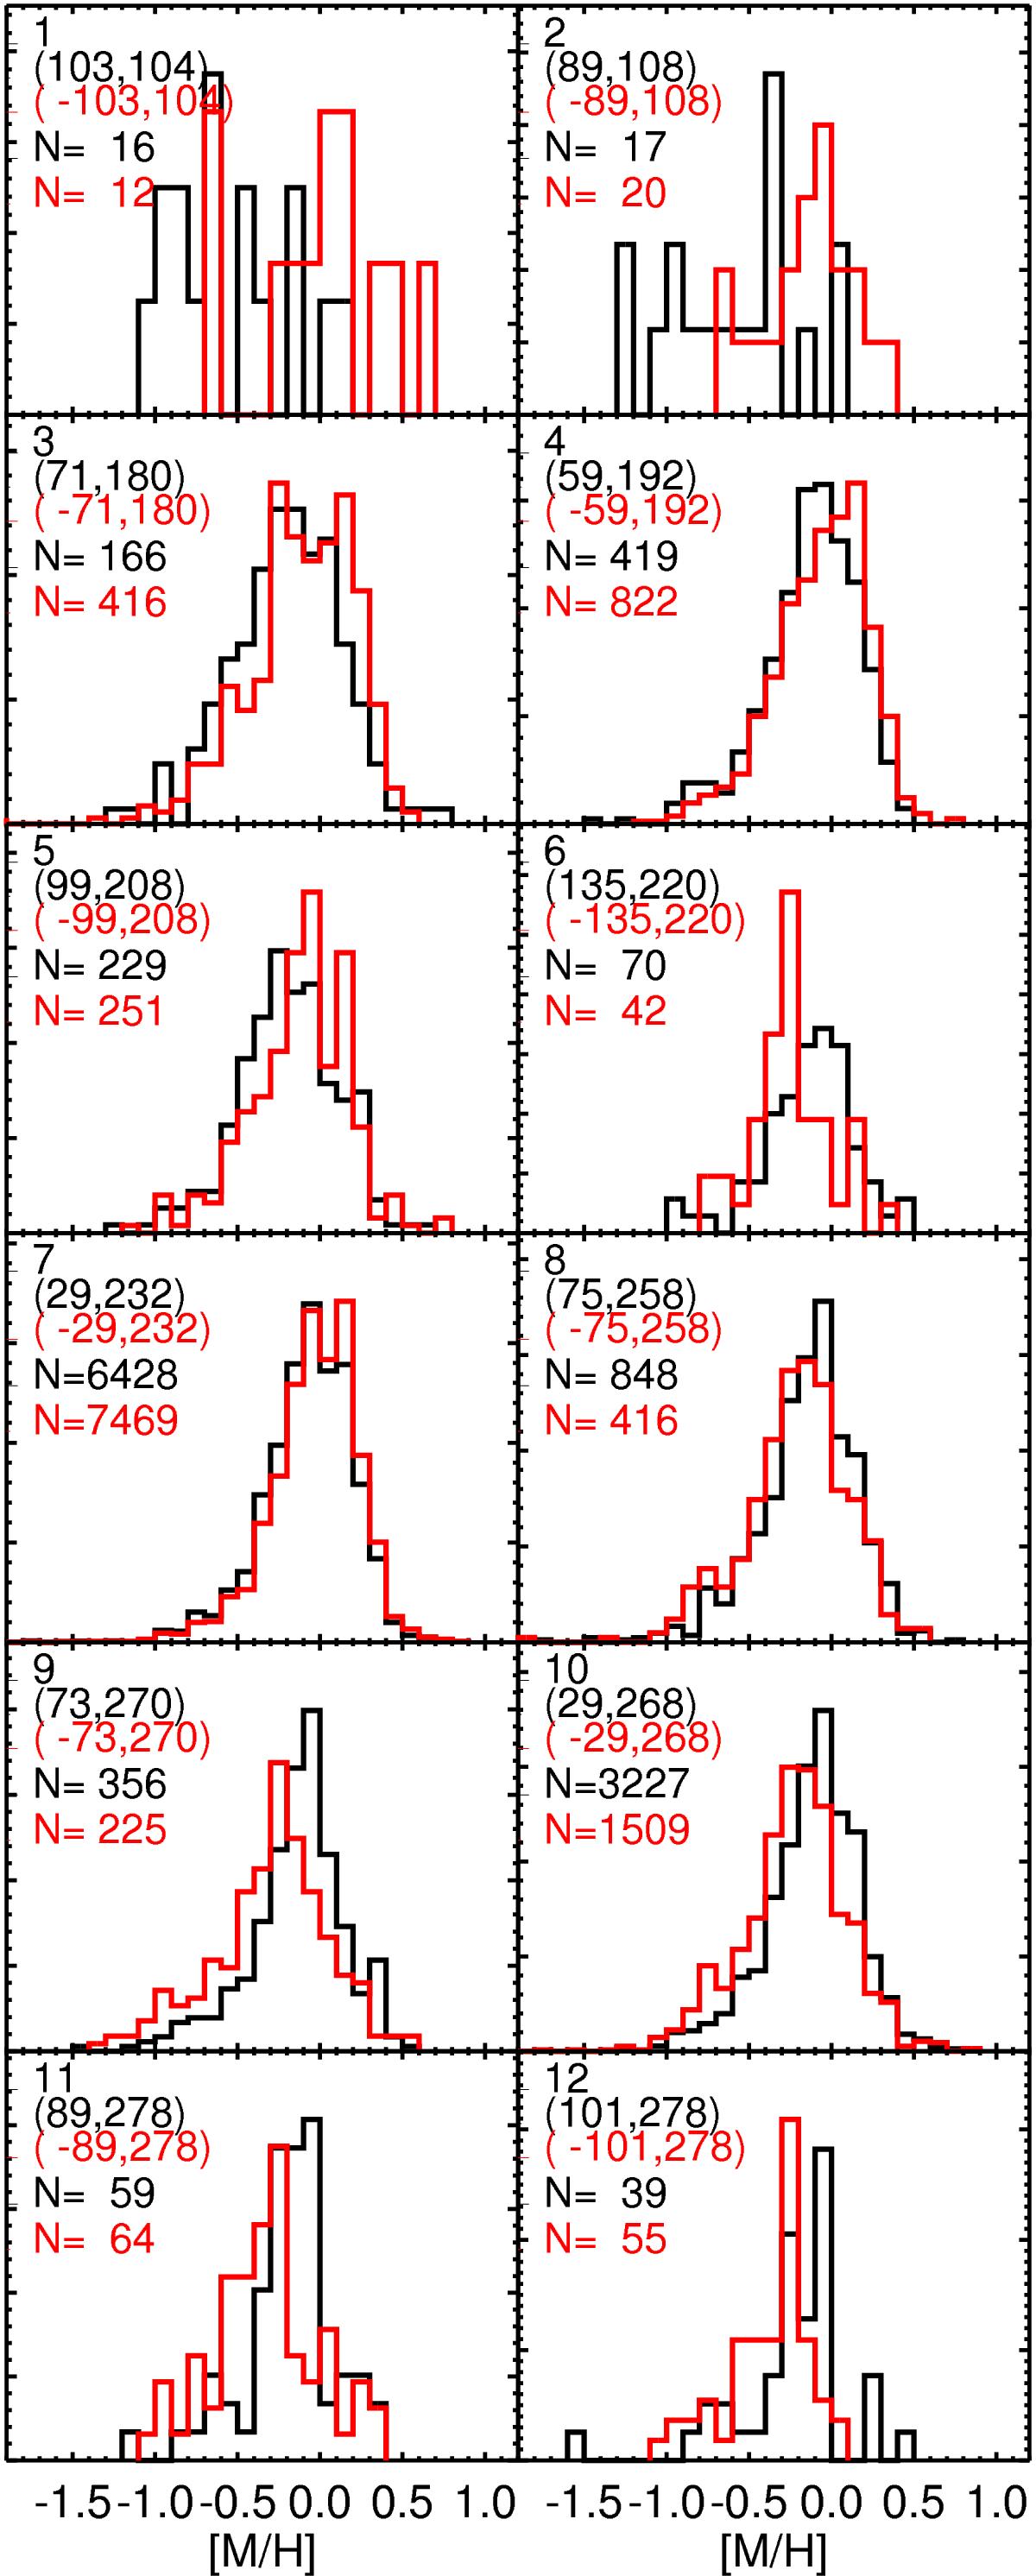
Metallicity distributions of the locations identified in velocity space where the median metallicity is different with 95% confidence between regions with opposite vR for the RAVE sample. The panels are numbered as in the right top panel of Fig. 1. Black and red histograms are normalized and correspond to the distributions for positive and negative vR, respectively.
Current usage metrics show cumulative count of Article Views (full-text article views including HTML views, PDF and ePub downloads, according to the available data) and Abstracts Views on Vision4Press platform.
Data correspond to usage on the plateform after 2015. The current usage metrics is available 48-96 hours after online publication and is updated daily on week days.
Initial download of the metrics may take a while.