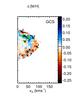
Fig. 1
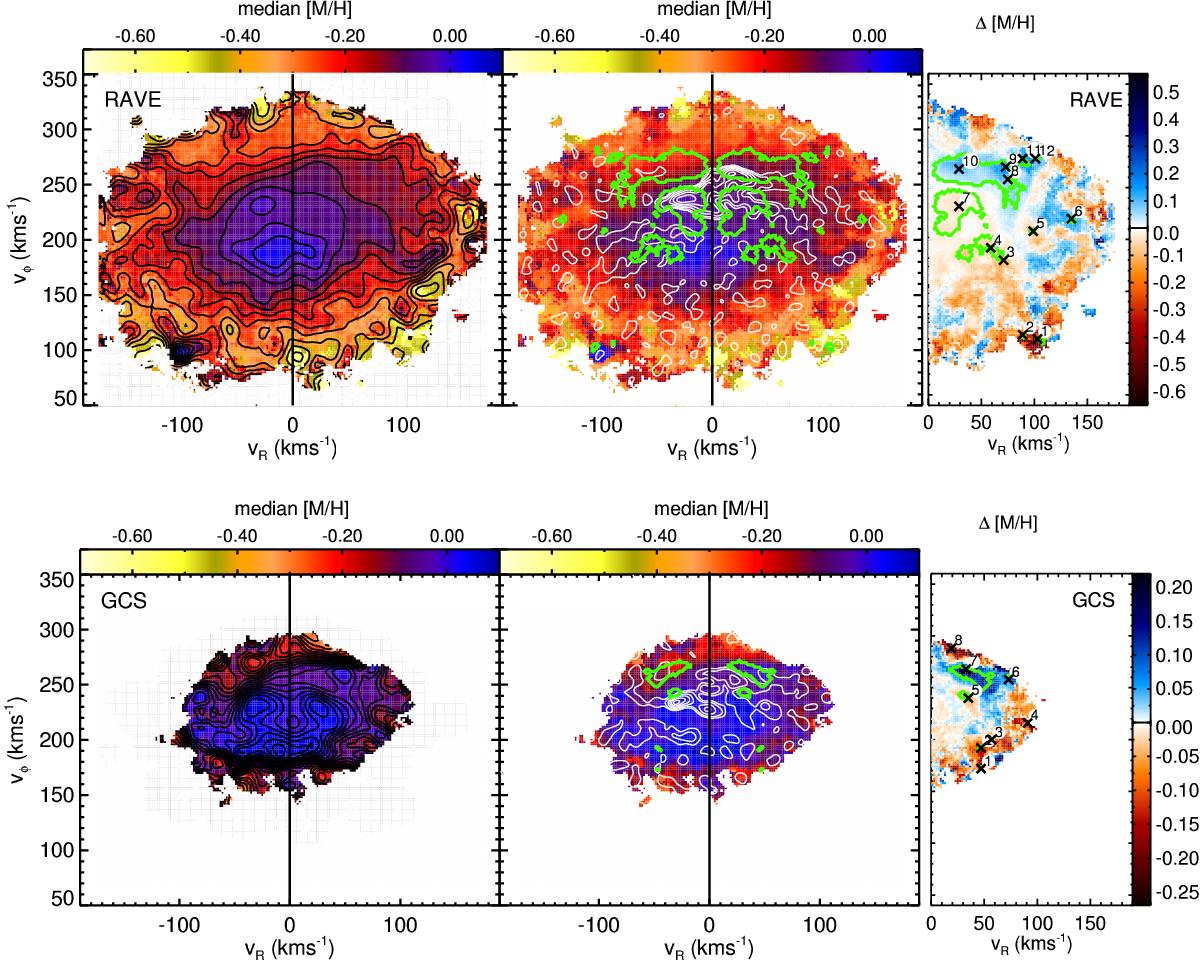
Top: median metallicity in the velocity plane of the local neighbourhood of the RAVE sample. Left panel: 25 logarithmically spaced contours in the range spanned by the metallicity, i.e. [−0.70, 0.06]. Middle panel: same as the left one but shows contours (white) of the wavelet transform that mark the main over-densities in the velocity plane, and contours (green) that indicate significant metallicity differences (95% confidence) from its symmetric vR region. Right panel: differences in the median metallicity for positive and negative vR. The green contours are the same as for the middle panel. The numbered labels are points identified as depicting clear differences in metallicity, and whose characteristics are given in Table 1. Bottom: same for the GCS sample, with the labelled points given in Table 2. Left panel: now 25 logarithmically spaced contours in the range of [−0.34, 0.1].
Current usage metrics show cumulative count of Article Views (full-text article views including HTML views, PDF and ePub downloads, according to the available data) and Abstracts Views on Vision4Press platform.
Data correspond to usage on the plateform after 2015. The current usage metrics is available 48-96 hours after online publication and is updated daily on week days.
Initial download of the metrics may take a while.