Fig. 4
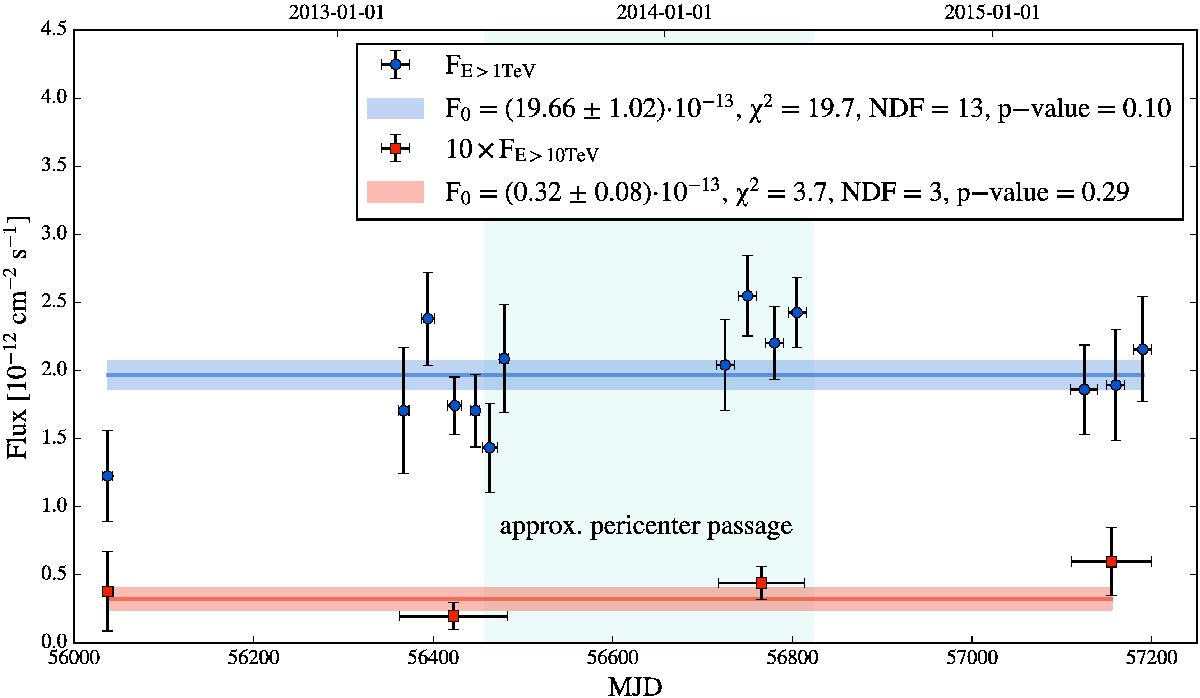
Light curves of the integral gamma-ray flux from the Galactic center for E > 1 TeV and E > 10 TeV. The red and blue lines represent the best fits to the constant flux, the corresponding shaded regions represent the 1σ confidence intervals. For E > 1 TeV the bins span over 10–30 days, whereas the yearly binning has been chosen for E > 10 TeV because of the low event count rate. The flux values of the latter have been multiplied by 10 for better visibility in the plot. Detailed information for each data point is given in Tables 2 and 3.
Current usage metrics show cumulative count of Article Views (full-text article views including HTML views, PDF and ePub downloads, according to the available data) and Abstracts Views on Vision4Press platform.
Data correspond to usage on the plateform after 2015. The current usage metrics is available 48-96 hours after online publication and is updated daily on week days.
Initial download of the metrics may take a while.