Fig. 3
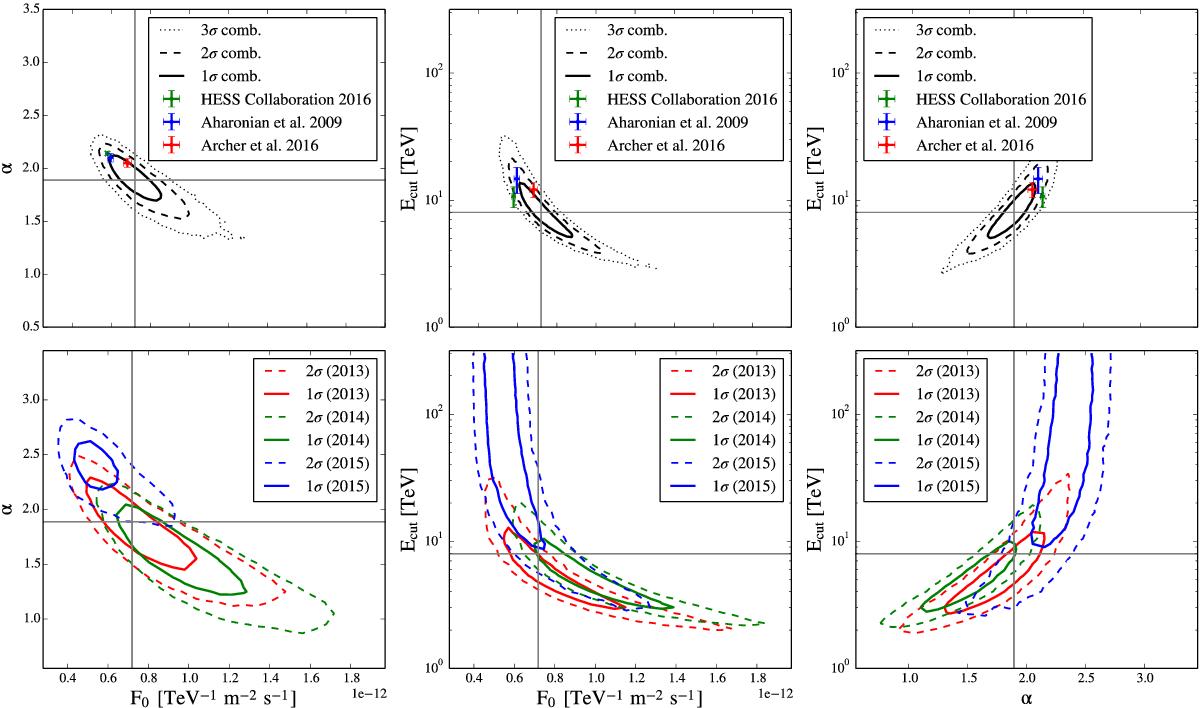
Top: 2D projections of the probability distribution in the parameter space of the SED fit for the combined 2012–2015 dataset. The SED was fit using a power-law with exponential cut-off model (see Sect. 3.1). The gray cross-hair marks the best fit values found in this work. The red and blue data points mark the best fit values and uncertainties as measured by H.E.S.S. (Aharonian et al. 2009) and H.E.S.S. with VERITAS combined (Archer et al. 2016). Bottom: the same for the 2013 (red), 2014 (green) and 2015 (blue) seasons separately. The contours correspond to 1, 2 and 3 (only for the full dataset, top) σ confidence levels.
Current usage metrics show cumulative count of Article Views (full-text article views including HTML views, PDF and ePub downloads, according to the available data) and Abstracts Views on Vision4Press platform.
Data correspond to usage on the plateform after 2015. The current usage metrics is available 48-96 hours after online publication and is updated daily on week days.
Initial download of the metrics may take a while.