Fig. 1
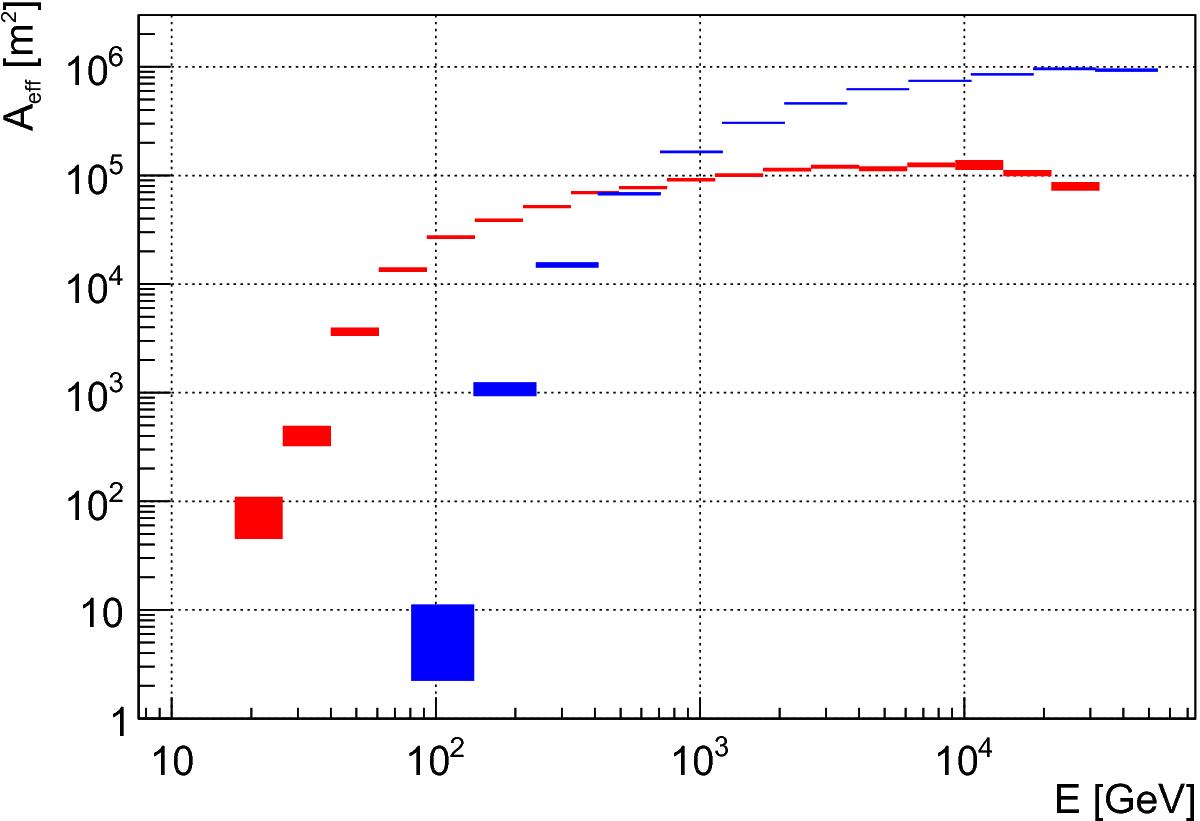
Effective collection area computed from Monte Carlo simulated events matching the zenith and azimuth distribution of the presented GC observation and after all cuts that were applied for computing the energy spectrum and light-curve (blue). The collection area for a typical low zenith angle (5° − 35°) observation is shown in red for comparison. One can clearly note the effect on the energy threshold and effective area due to the larger Zd.
Current usage metrics show cumulative count of Article Views (full-text article views including HTML views, PDF and ePub downloads, according to the available data) and Abstracts Views on Vision4Press platform.
Data correspond to usage on the plateform after 2015. The current usage metrics is available 48-96 hours after online publication and is updated daily on week days.
Initial download of the metrics may take a while.