Free Access
Fig. 6
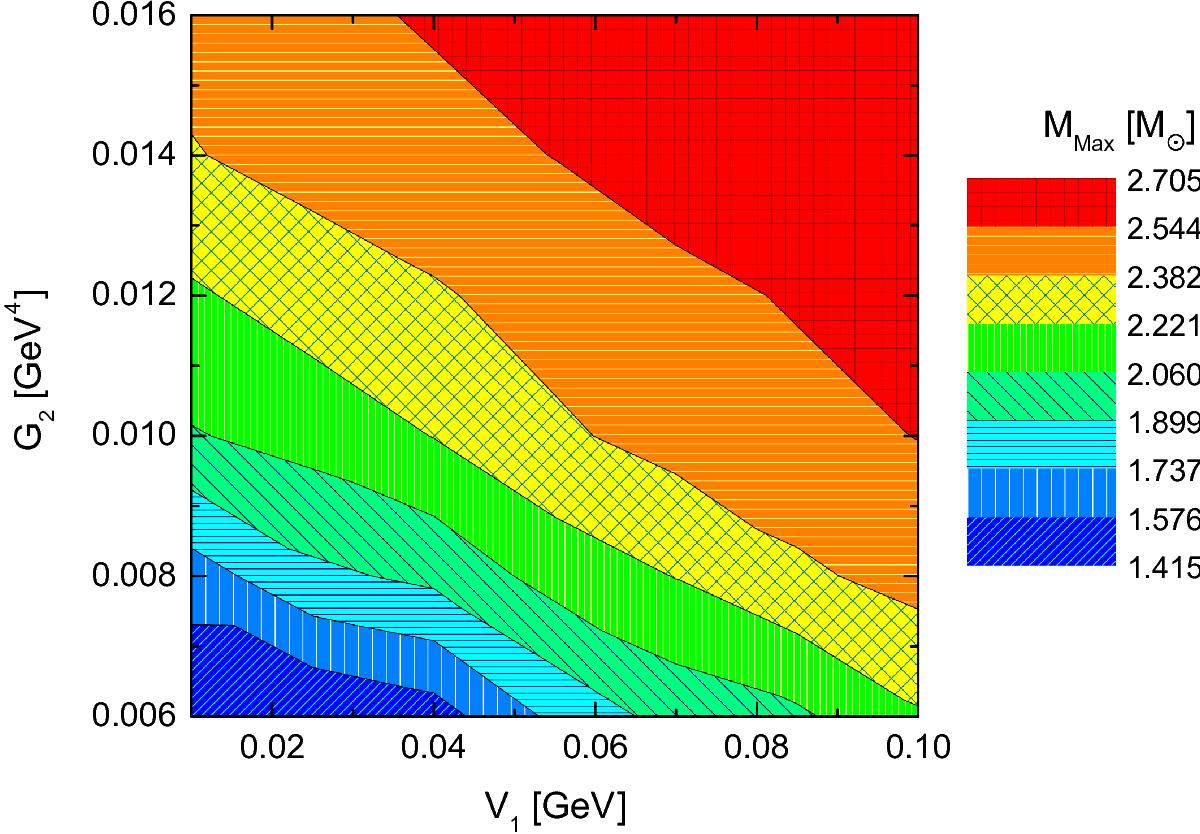
Maximum mass of each family of stars as a function of V1 and G2 at s = 0. Inside each contour area, the maximum mass increases monotonically as the values V1 and G2 increase.
Current usage metrics show cumulative count of Article Views (full-text article views including HTML views, PDF and ePub downloads, according to the available data) and Abstracts Views on Vision4Press platform.
Data correspond to usage on the plateform after 2015. The current usage metrics is available 48-96 hours after online publication and is updated daily on week days.
Initial download of the metrics may take a while.