Fig. 14
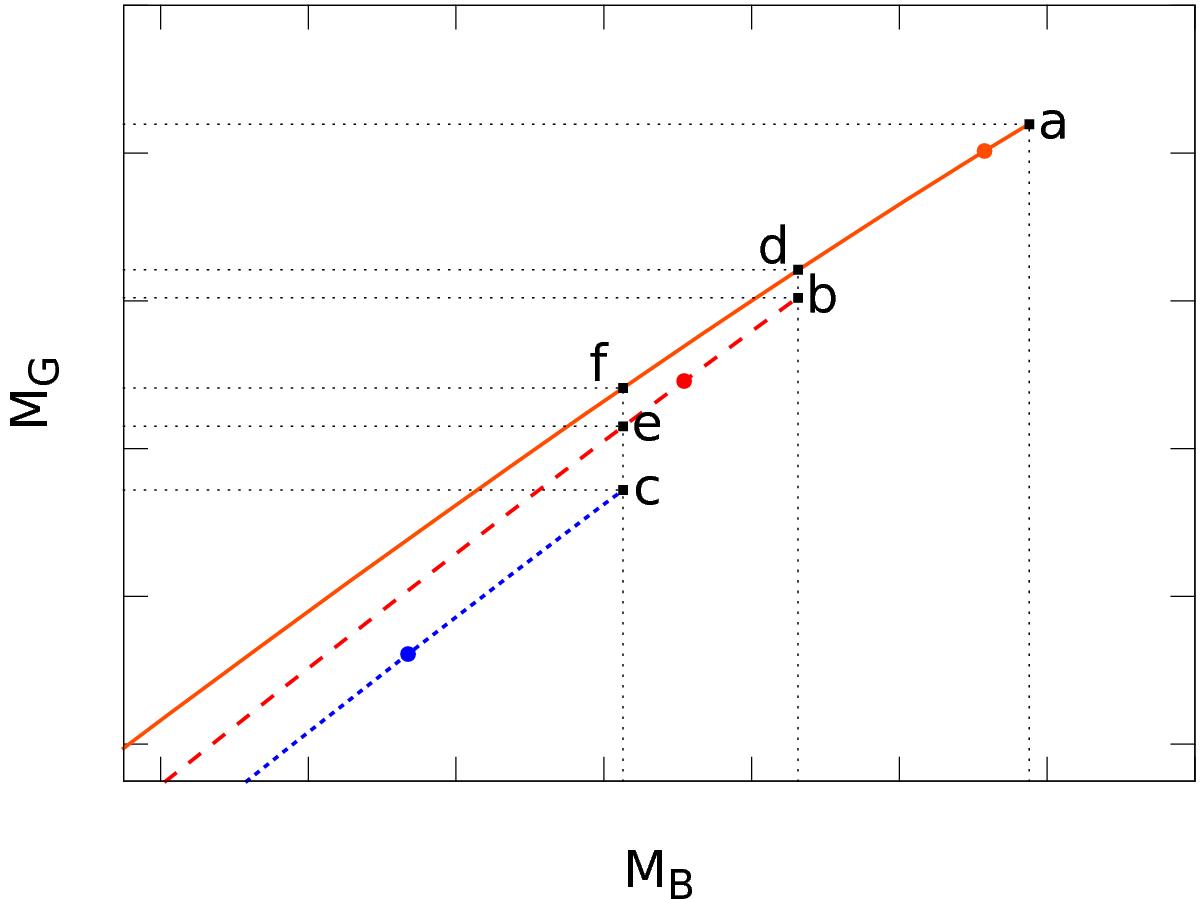
Enlarged MG−MB plane for V1 = 0.03 GeV and G2 = 0.010 GeV4 close to the maximum mass configurations. In each constant-entropy curve, the rounded dot indicates the appearance of the quark matter core. The squared points a, b and c indicate the maximum mass configuration for s ≃ 1, s ≃ 2 and s = 0, respectively. The squared dot d indicates the initial configuration that evolves, through a constant baryonic mass vertical line, to the maximum mass configuration of the curve s ≃ 2. Only for proto-HS with baryonic masses ![]() , a constant baryonic mass vertical line can be drawn across the dots f, e and c and the three isentropic curves. Thus, such stars will remain stable, surviving the evolutionary process towards a cold HS.
, a constant baryonic mass vertical line can be drawn across the dots f, e and c and the three isentropic curves. Thus, such stars will remain stable, surviving the evolutionary process towards a cold HS.
Current usage metrics show cumulative count of Article Views (full-text article views including HTML views, PDF and ePub downloads, according to the available data) and Abstracts Views on Vision4Press platform.
Data correspond to usage on the plateform after 2015. The current usage metrics is available 48-96 hours after online publication and is updated daily on week days.
Initial download of the metrics may take a while.