Fig. 1
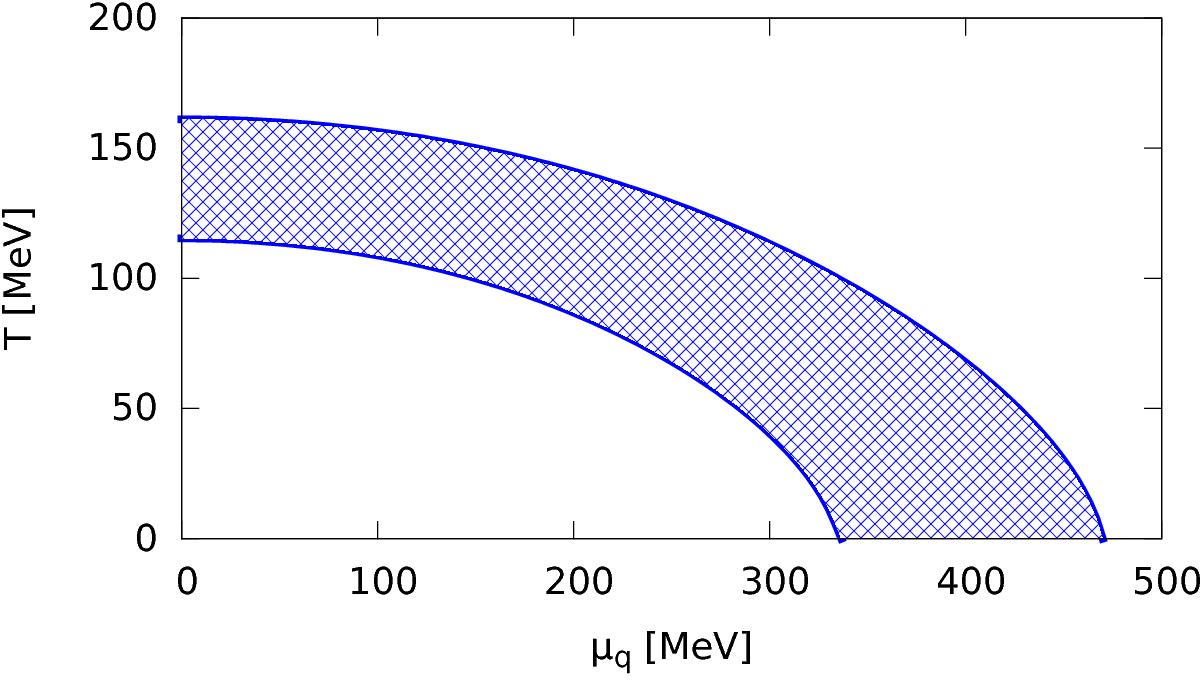
Schematic phase diagram in the T−μ plane. The lower curve defines the phase transition between confined and deconfined matter for V1 = 0.01 GeV and G2 = 0.006 GeV4, while the upper one defines the phase transition curve for V1 = 0.10 GeV and G2 = 0.016 GeV4. The shaded area indicates the region of the FCM parameters considered in this work, 0.01 GeV ≤ V1 ≤ 0.10 GeV and 0.006 GeV4 ≤ G2 ≤ 0.016 GeV4.
Current usage metrics show cumulative count of Article Views (full-text article views including HTML views, PDF and ePub downloads, according to the available data) and Abstracts Views on Vision4Press platform.
Data correspond to usage on the plateform after 2015. The current usage metrics is available 48-96 hours after online publication and is updated daily on week days.
Initial download of the metrics may take a while.