Free Access
Fig. 9
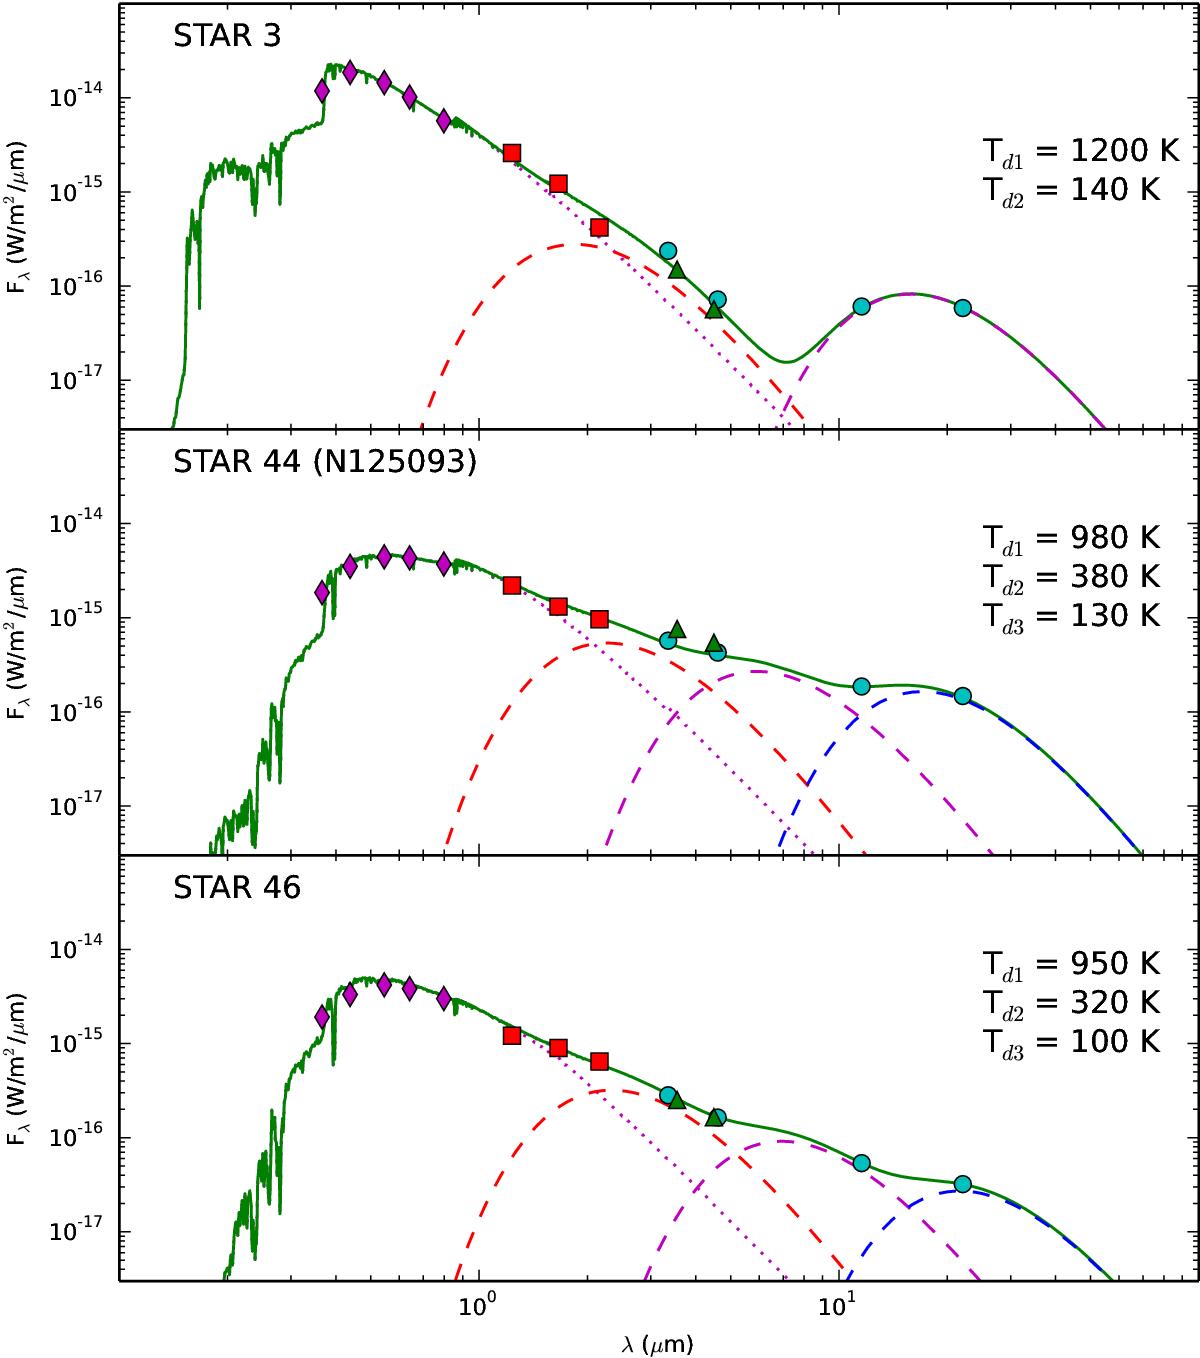
Spectral energy distributions (similar to Fig. 8) for the three spectroscopic targets observed with GTC with no available time-series photometry. Optical UBVRI counterparts are taken from Massey et al. (2006). An additional component (dashed magenta line) is used in two stars to fit thermal emission from warm dust.
Current usage metrics show cumulative count of Article Views (full-text article views including HTML views, PDF and ePub downloads, according to the available data) and Abstracts Views on Vision4Press platform.
Data correspond to usage on the plateform after 2015. The current usage metrics is available 48-96 hours after online publication and is updated daily on week days.
Initial download of the metrics may take a while.