Fig. 8
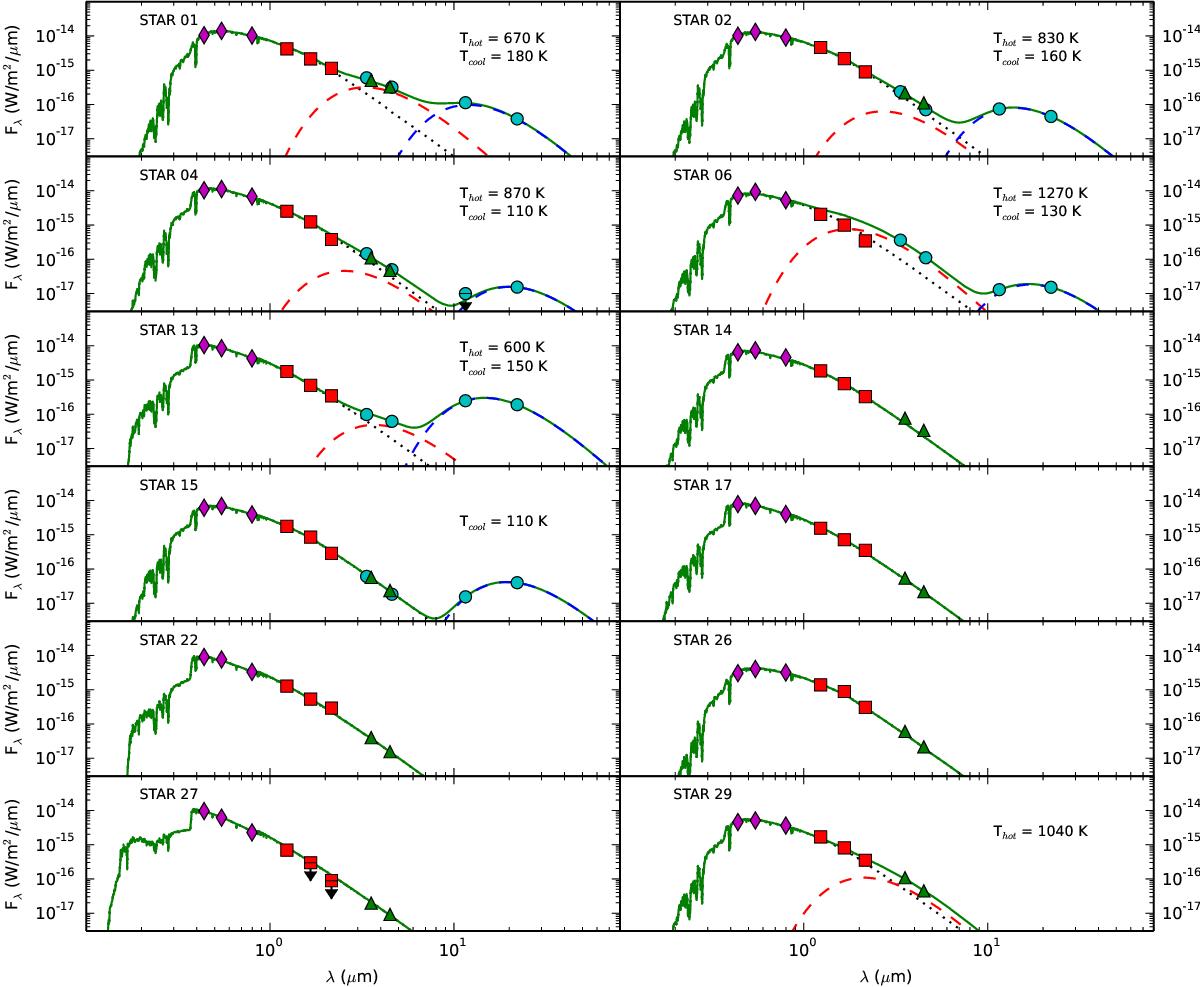
Spectral energy distributions for the first 12 stars from Table 4. We show observations from DIRECT in BVIc (magenta diamonds), from 2MASS in J, H , Ks (red squares), from Spitzer at [3.6] and [4.5] (green triangles) and from WISE at 3.4, 4.6, 12, and 22 μm (cyan circles). An arrow indicates an upper limit in the flux. The best-fitting model (solid green line) comprises the reddened, Kurucz photospheric component (dotted black line), a hot dust or free-free emission component (dashed red line) and a cool dust component (dashed blue line). Spectral energy distributions for the remaining nine stars are shown in Appendix A.
Current usage metrics show cumulative count of Article Views (full-text article views including HTML views, PDF and ePub downloads, according to the available data) and Abstracts Views on Vision4Press platform.
Data correspond to usage on the plateform after 2015. The current usage metrics is available 48-96 hours after online publication and is updated daily on week days.
Initial download of the metrics may take a while.