Fig. 6
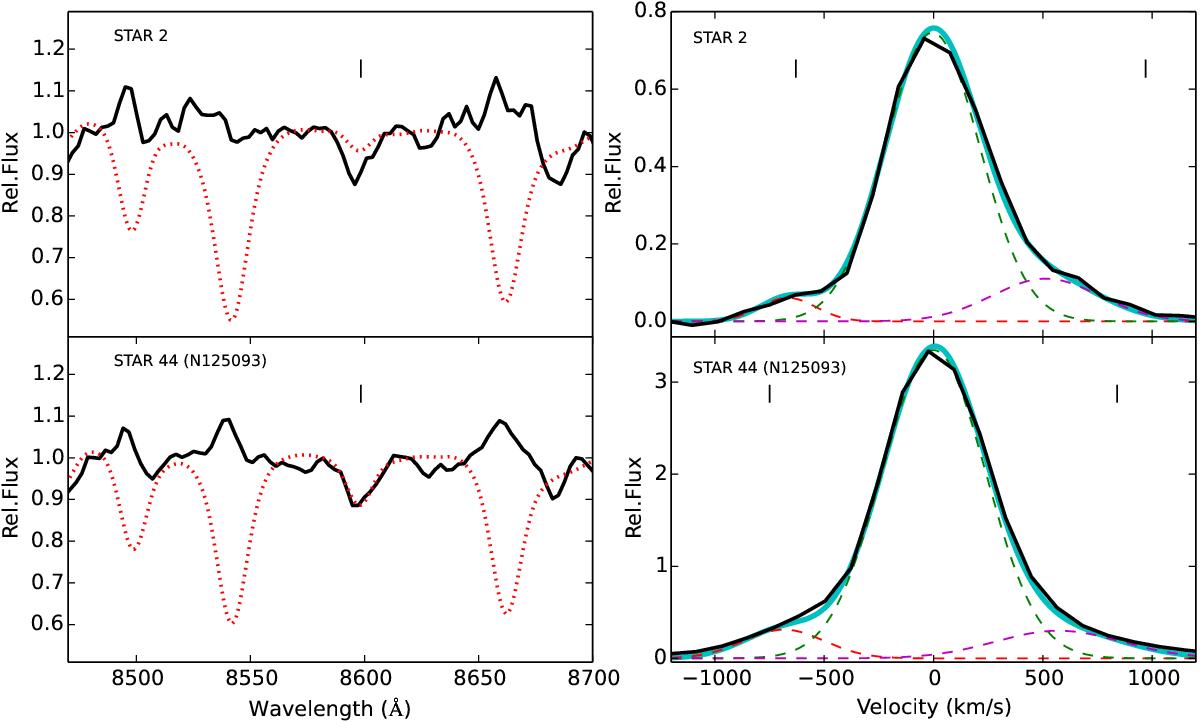
Left. Spectral region 8470−8700Å for stars 2 and 44, which show Ca ii in emission (thick black line). The vertical line marks the rest wavelength of the P14 hydrogen line from the Paschen series at 8598.4 Å. Synthetic spectra from Munari et al. (2005) corresponding to the SED-fit temperatures of 5500 and 6250 K are superposed on the spectra of stars 2 and 44, respectively, blueshifted to optimally fit the P14 line. Right. Analysis of the Hα feature of the same stars shown in the left panel. Red- and blue-shifted wings are indicated with dashed lines. The vertical lines indicate the velocities of the [N ii] λ6548,6583 lines relevant to the central Hα component and corrected for the value inferred from the measurement of O i. The total composite emission is shown with a thick blue line, fitting observations indicated with a black line.
Current usage metrics show cumulative count of Article Views (full-text article views including HTML views, PDF and ePub downloads, according to the available data) and Abstracts Views on Vision4Press platform.
Data correspond to usage on the plateform after 2015. The current usage metrics is available 48-96 hours after online publication and is updated daily on week days.
Initial download of the metrics may take a while.