Fig. 5
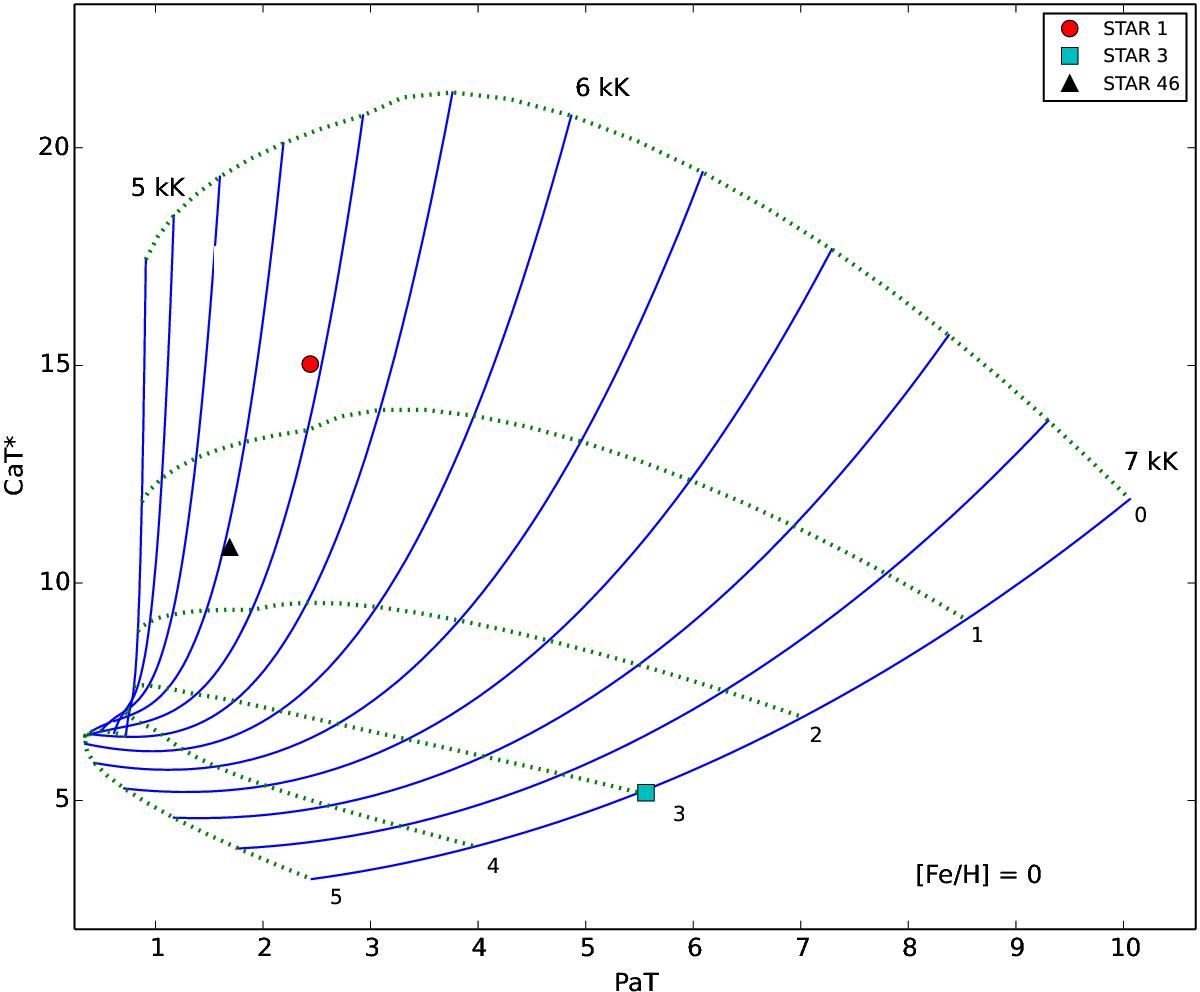
Grid of atmospheric parameters as a function of the two generic indices CaT* and PaT, which measure the strength of Ca ii and Paschen lines, respectively. We show the positions on the grid of the three spectroscopic targets observed with the GTC, which show absorption in the Ca ii triplet. From left to right, solid lines indicate temperatures at the range 4800−7000 K with a step of 200 K. Dotted lines correspond to log g values of 0 to 5, with a step of 1 dex, as CaT* decreases.
Current usage metrics show cumulative count of Article Views (full-text article views including HTML views, PDF and ePub downloads, according to the available data) and Abstracts Views on Vision4Press platform.
Data correspond to usage on the plateform after 2015. The current usage metrics is available 48-96 hours after online publication and is updated daily on week days.
Initial download of the metrics may take a while.