Fig. 2
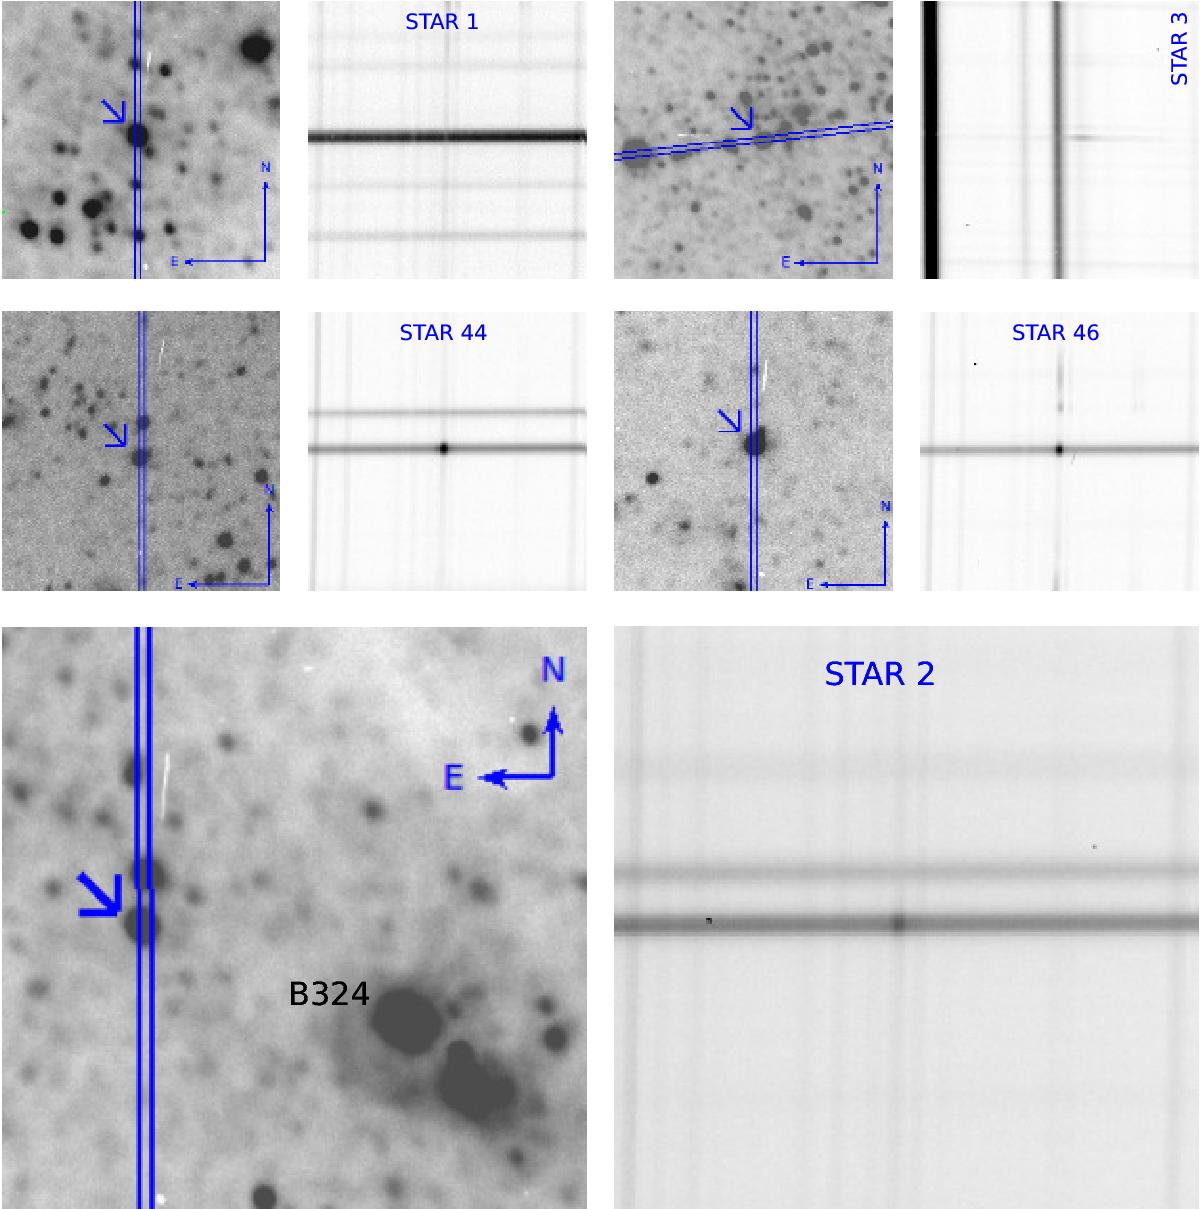
Pairs of panels for the five targets observed with OSIRIS/GTC. In the left panel of each set, we show an 1′× 1′ spatial view of the target in Sloan r′ band. North is up, east is left. The slit in each case is shown with solid lines and targets are indicated with blue arrows. In the right panel of each set, we show the respective two-dimensional portion of the GTC spectrum of the object, centered on the Hα line. We particularly emphasize star 2 (large set of panels) and indicate the candidate LBV/YHG B324, located ~30″ away.
Current usage metrics show cumulative count of Article Views (full-text article views including HTML views, PDF and ePub downloads, according to the available data) and Abstracts Views on Vision4Press platform.
Data correspond to usage on the plateform after 2015. The current usage metrics is available 48-96 hours after online publication and is updated daily on week days.
Initial download of the metrics may take a while.