Fig. 12
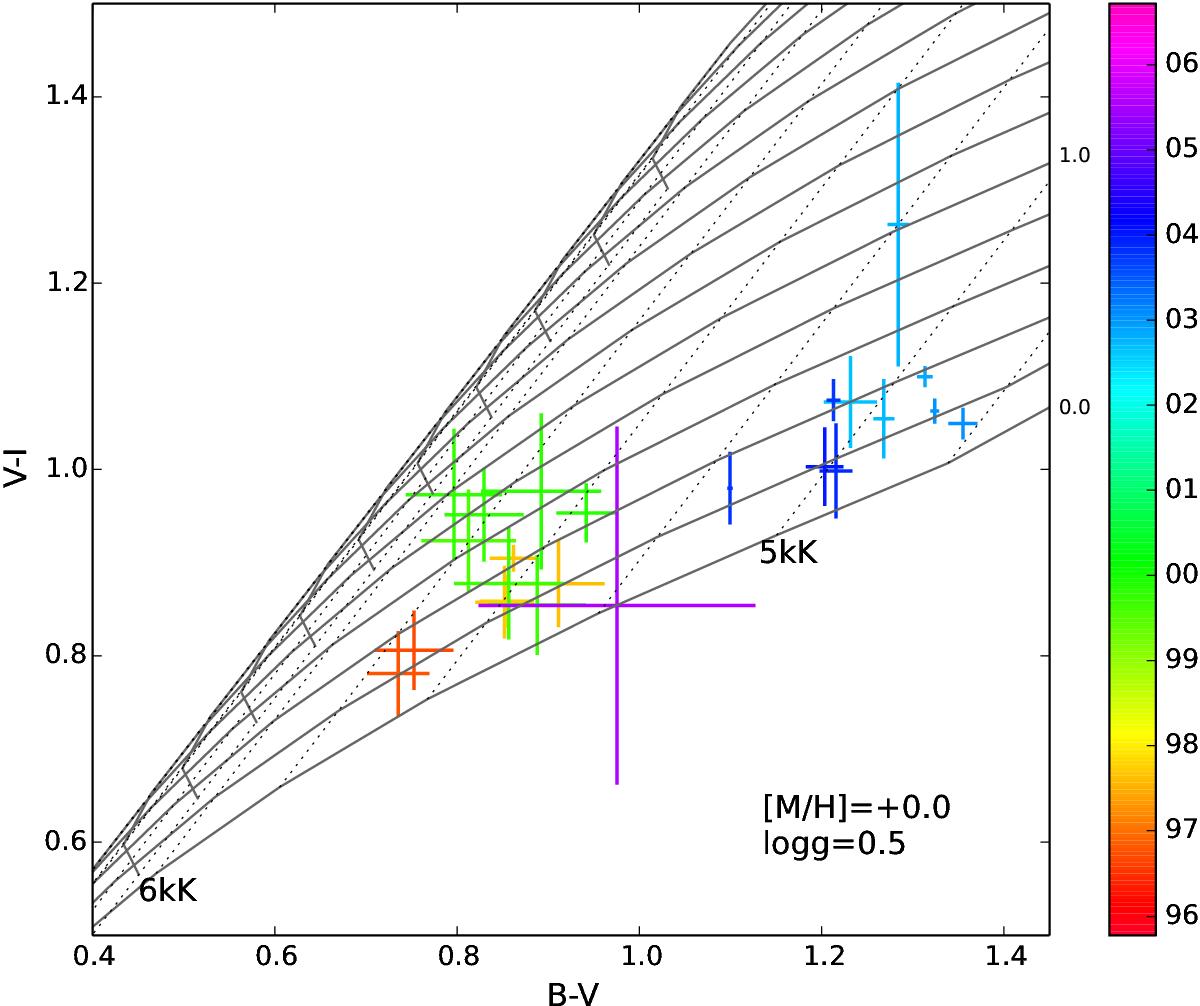
Time evolution of star 2 on the V−I vs. B−V CCD, color coded by year, superposed on a grid of Teff and AV. From right to left, temperature increases with a step of 250 K and is shown as a dotted line. Temperatures of 5 kK and 6 kK are noted. From the bottom up, the solid lines indicate models with increasing extinction, with a step of 0.2 mag. AV values of 0.0 and 1.0 mag are noted in the right side of the panel. We note the degeneracy of the parameters for Teff> 6000 K.
Current usage metrics show cumulative count of Article Views (full-text article views including HTML views, PDF and ePub downloads, according to the available data) and Abstracts Views on Vision4Press platform.
Data correspond to usage on the plateform after 2015. The current usage metrics is available 48-96 hours after online publication and is updated daily on week days.
Initial download of the metrics may take a while.