Fig. 11
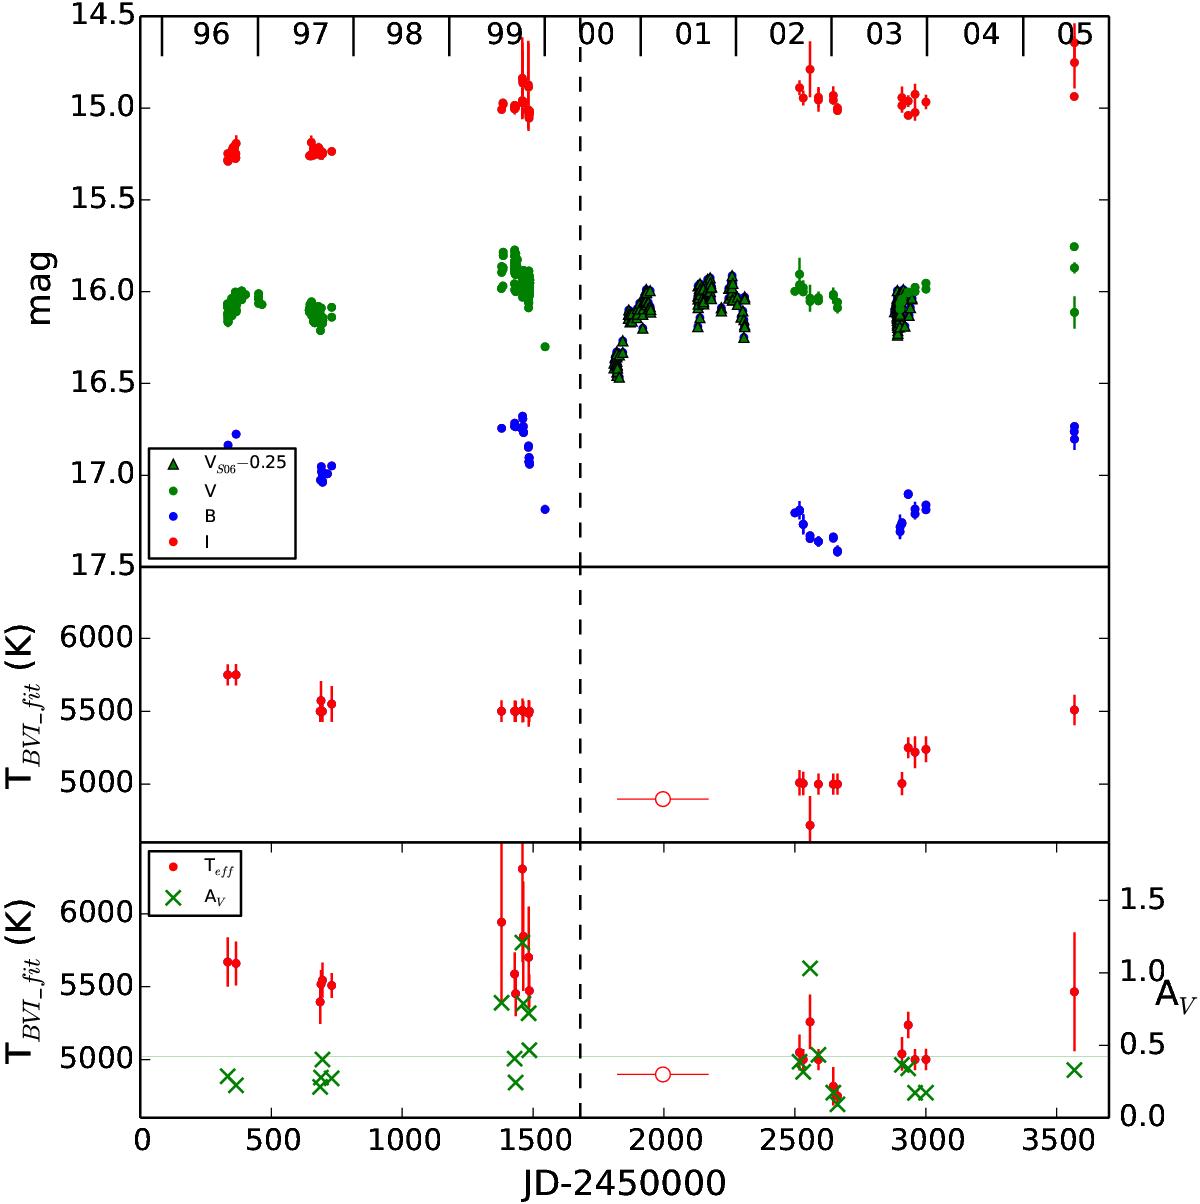
Upper panel: The BVIc light curves for star 2 (Macri et al. 2001; Pellerin & Macri 2011). V-band photometry from Shporer & Mazeh (2006) is shown as green triangles, corrected by 0.25 mag. Uncertainties are indicated with error bars. The dashed line at JD 2 451 680 (mid-May 2000), serves as an approximation for the date when the fading event reaches a minimum. Middle panel: A zoomed view of the best-fit temperatures for star 2 from Fig. 7. Lower panel: Same as in the middle panel, but having visual extinction (green crosses) as a free parameter. A green line indicates the average extinction of M 33, at AV = 0.4 mag.
Current usage metrics show cumulative count of Article Views (full-text article views including HTML views, PDF and ePub downloads, according to the available data) and Abstracts Views on Vision4Press platform.
Data correspond to usage on the plateform after 2015. The current usage metrics is available 48-96 hours after online publication and is updated daily on week days.
Initial download of the metrics may take a while.