Fig. 10
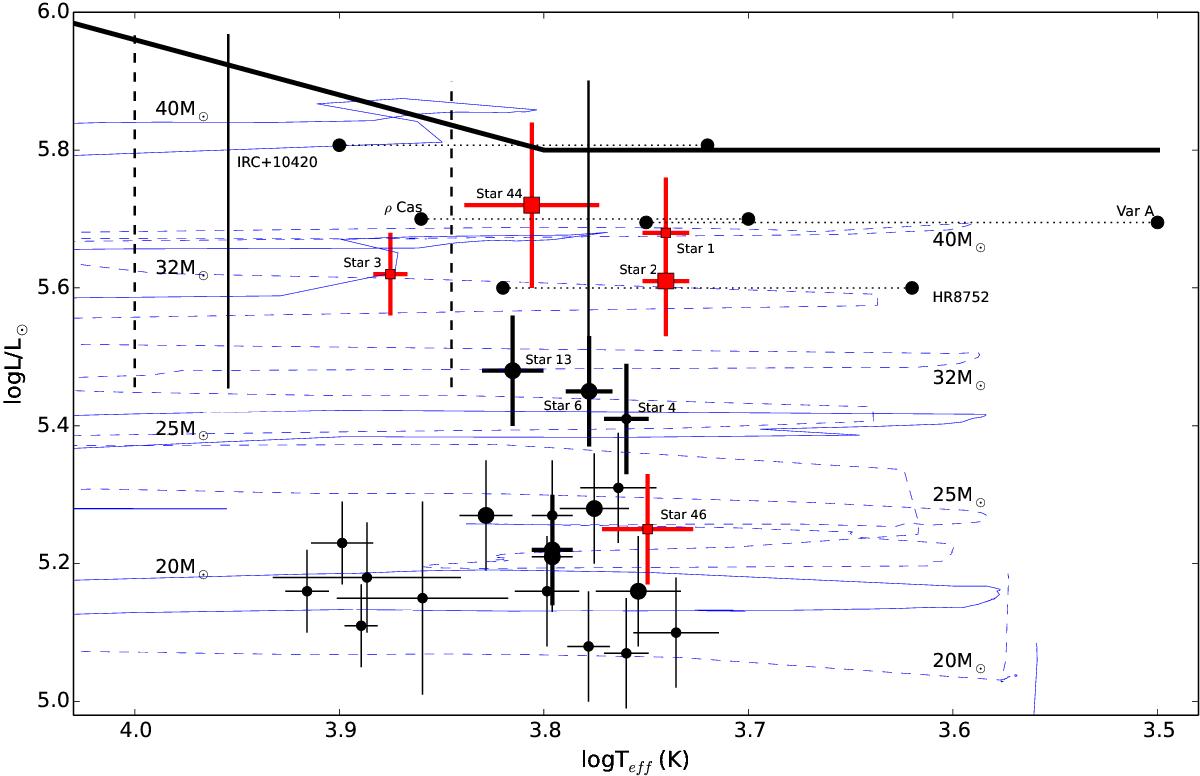
Hertzsprung-Russell diagram for the 21 long-term monitored YSGs in M 33 (black circles) and for the five spectroscopic targets (red squares). Error bars correspond to 2σ uncertainties. We emphasize with thick crosses those stars that show emission in the infrared from both hot and cool dust. The candidate YHGs/post-RSGs suggested in this study are marked with large symbols. Labels are shown for selected stars discussed in the text. The solid vertical lines at 6000 and 9000 K indicate the borders of the YV (Humphreys et al. 2002), which extends above log L/L⊙ = 5.4 and below the Humphreys-Davidson limit (solid thick line). The suggested YV by de Jager (1998), lying within 7000−10 000 K, is illustrated by the dashed vertical lines. Evolutionary tracks are taken from Ekström et al. (2012) at Z = Z⊙, non-rotating (dashed blue lines) and at the 40% of the critical velocity (solid blue lines) for masses indicated on the right for the former and on the left for the latter. The dotted lines connecting black solid circles indicate the variability in the temperature of four known YHGs: ρ Cas (Lobel et al. 2003), IRC+10420 (Oudmaijer 1998), HR8752 (de Jager & Nieuwenhuijzen 1997) in the Galaxy, and Var A (Humphreys et al. 1987) in M 33.
Current usage metrics show cumulative count of Article Views (full-text article views including HTML views, PDF and ePub downloads, according to the available data) and Abstracts Views on Vision4Press platform.
Data correspond to usage on the plateform after 2015. The current usage metrics is available 48-96 hours after online publication and is updated daily on week days.
Initial download of the metrics may take a while.