Fig. 5
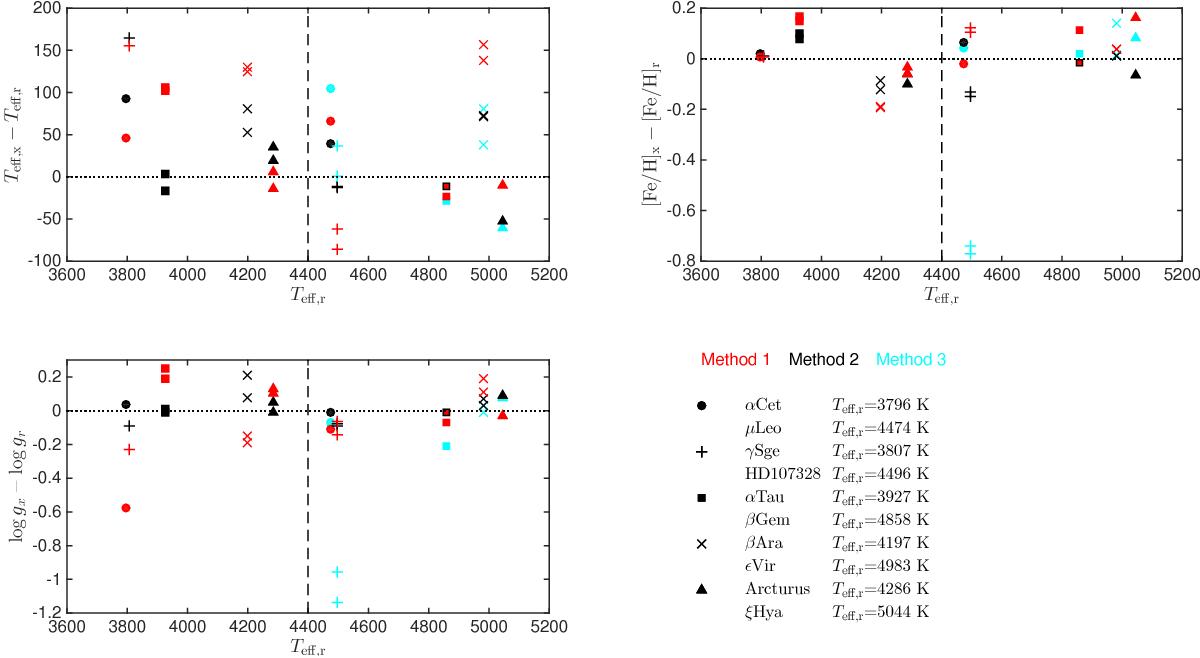
Comparison of the stellar parameters derived using the three methods discussed in Sects. 4.3.1 till 4.3.3 with the reference values (Table 2). On each y-axis is indicated the difference between the values we have obtained and the reference value (indicated by a subscript “r”). Method 1 is indicated by red symbols, Method 2 by black, and Method 3 is indicated by cyan symbols. Different symbols represent the different stars (as indicated in the figure, note that each symbol represent two stars. They should be easy to identify thanks to their different Teff). Note that some stars have more than one spectrum analysed (see Sect. 2.1.1). The stars can be identified by their recommended Teff which is plotted on the x-axis. The dashed line indicates the separation of “cool” (left) and “warm” (right) giants (see Sect. 4.3.2).
Current usage metrics show cumulative count of Article Views (full-text article views including HTML views, PDF and ePub downloads, according to the available data) and Abstracts Views on Vision4Press platform.
Data correspond to usage on the plateform after 2015. The current usage metrics is available 48-96 hours after online publication and is updated daily on week days.
Initial download of the metrics may take a while.